User Profiles and Event History — stratif.io
People gives you a user-level view of your data — individual profiles, event timelines, and properties for any user in your warehouse.
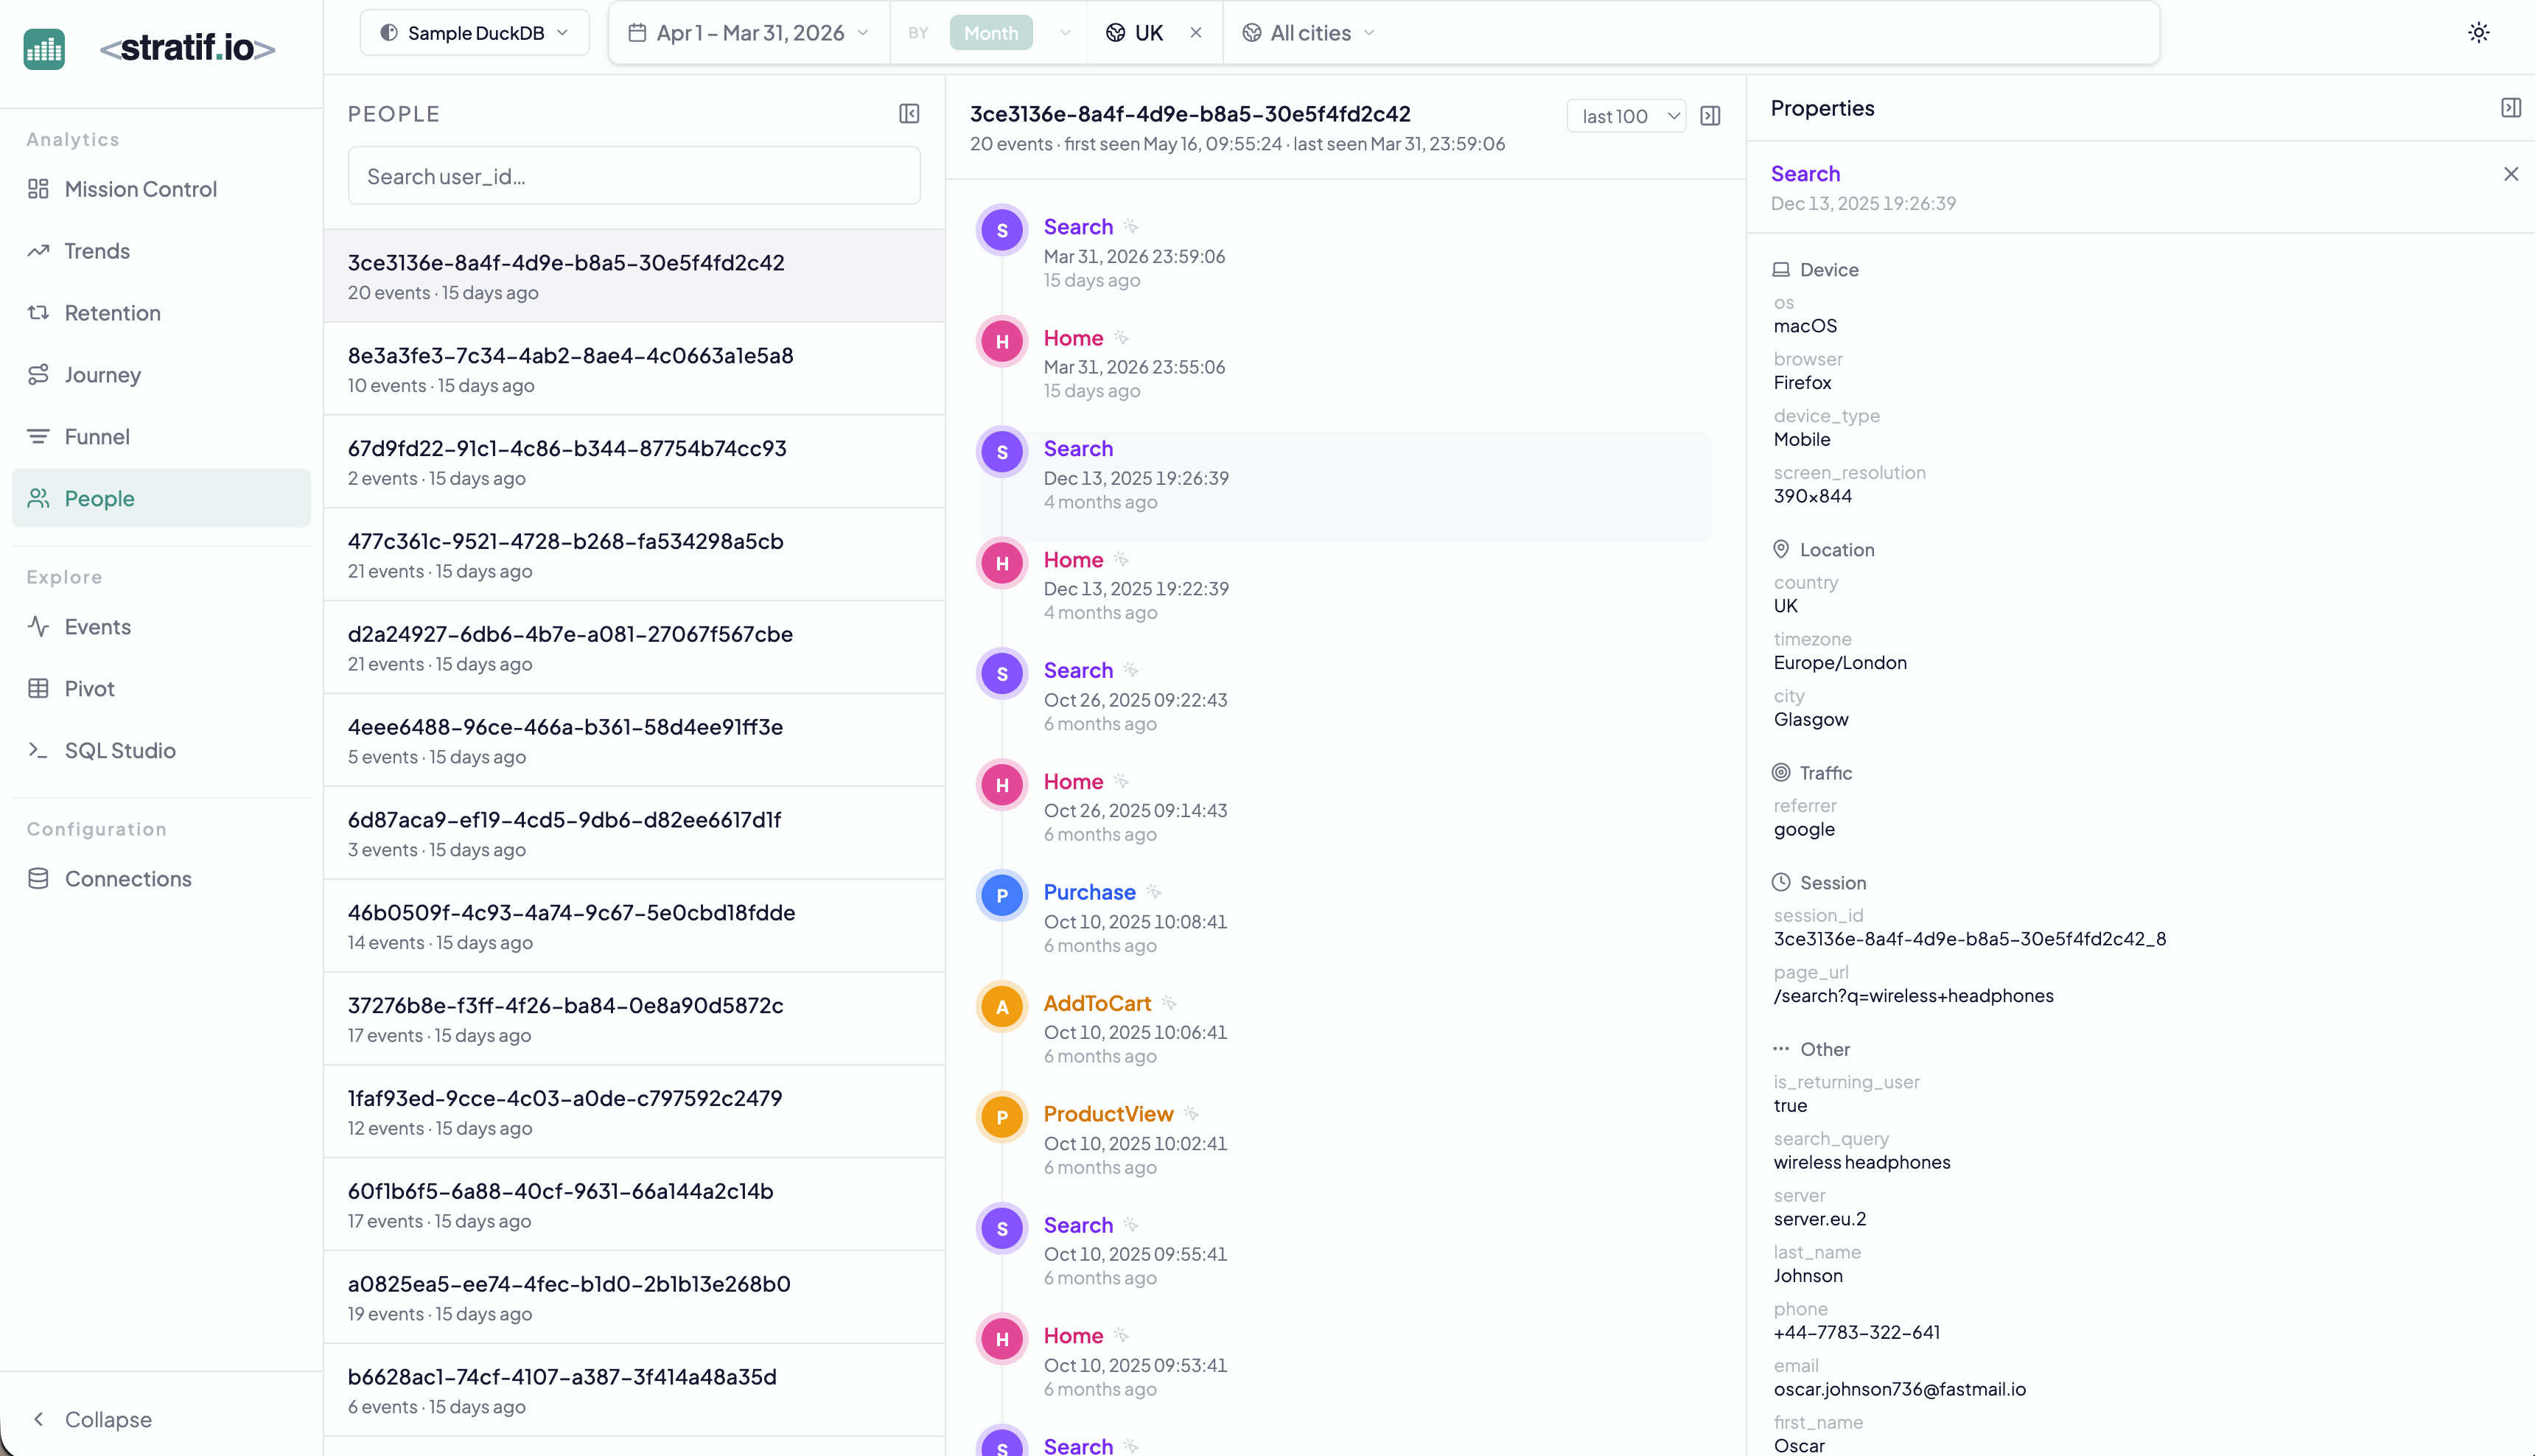
User list
The left panel lists all users in your events table, ordered by most recent activity. Each row shows the user ID, a count of total events, and how long ago they were last seen.
Use the search box to look up a specific user by ID.
Event timeline
Select any user to see their full chronological event history — every event they fired, with its timestamp, event name, and properties. The timeline reads top to bottom from most recent to oldest.
Why it matters: Aggregate metrics show you what the crowd does. The People view shows you what a real person does. When a metric looks wrong, look at a few individual users who are driving it — you’ll often find the explanation in their specific behaviour.
Properties panel
The right panel shows the properties associated with the most recent event: device, OS, location, and any custom properties stored in your events table. This is the equivalent of a CRM record built entirely from your warehouse data — no separate data entry required.
Filtering carries through
Global filters apply to the People list. Set country = UK and you see only UK users. Set a date range and you see only users active in that window. This makes People a fast qualitative research tool: filter to your target segment, then read individual journeys to understand the behaviour behind the numbers.
When to use People
- Debugging: a user reports a bug — look up their exact event sequence to reproduce it
- Qualitative research: after finding a retention drop, read the timelines of churned users to see what happened before they stopped coming back
- Sales/support: understand what a specific customer has done in your product before a call
View the SQL
Every metric and chart on this page has a SQL badge. Click it to open the exact query stratif.io ran against your warehouse to produce that number — joins, window functions, filters and all.
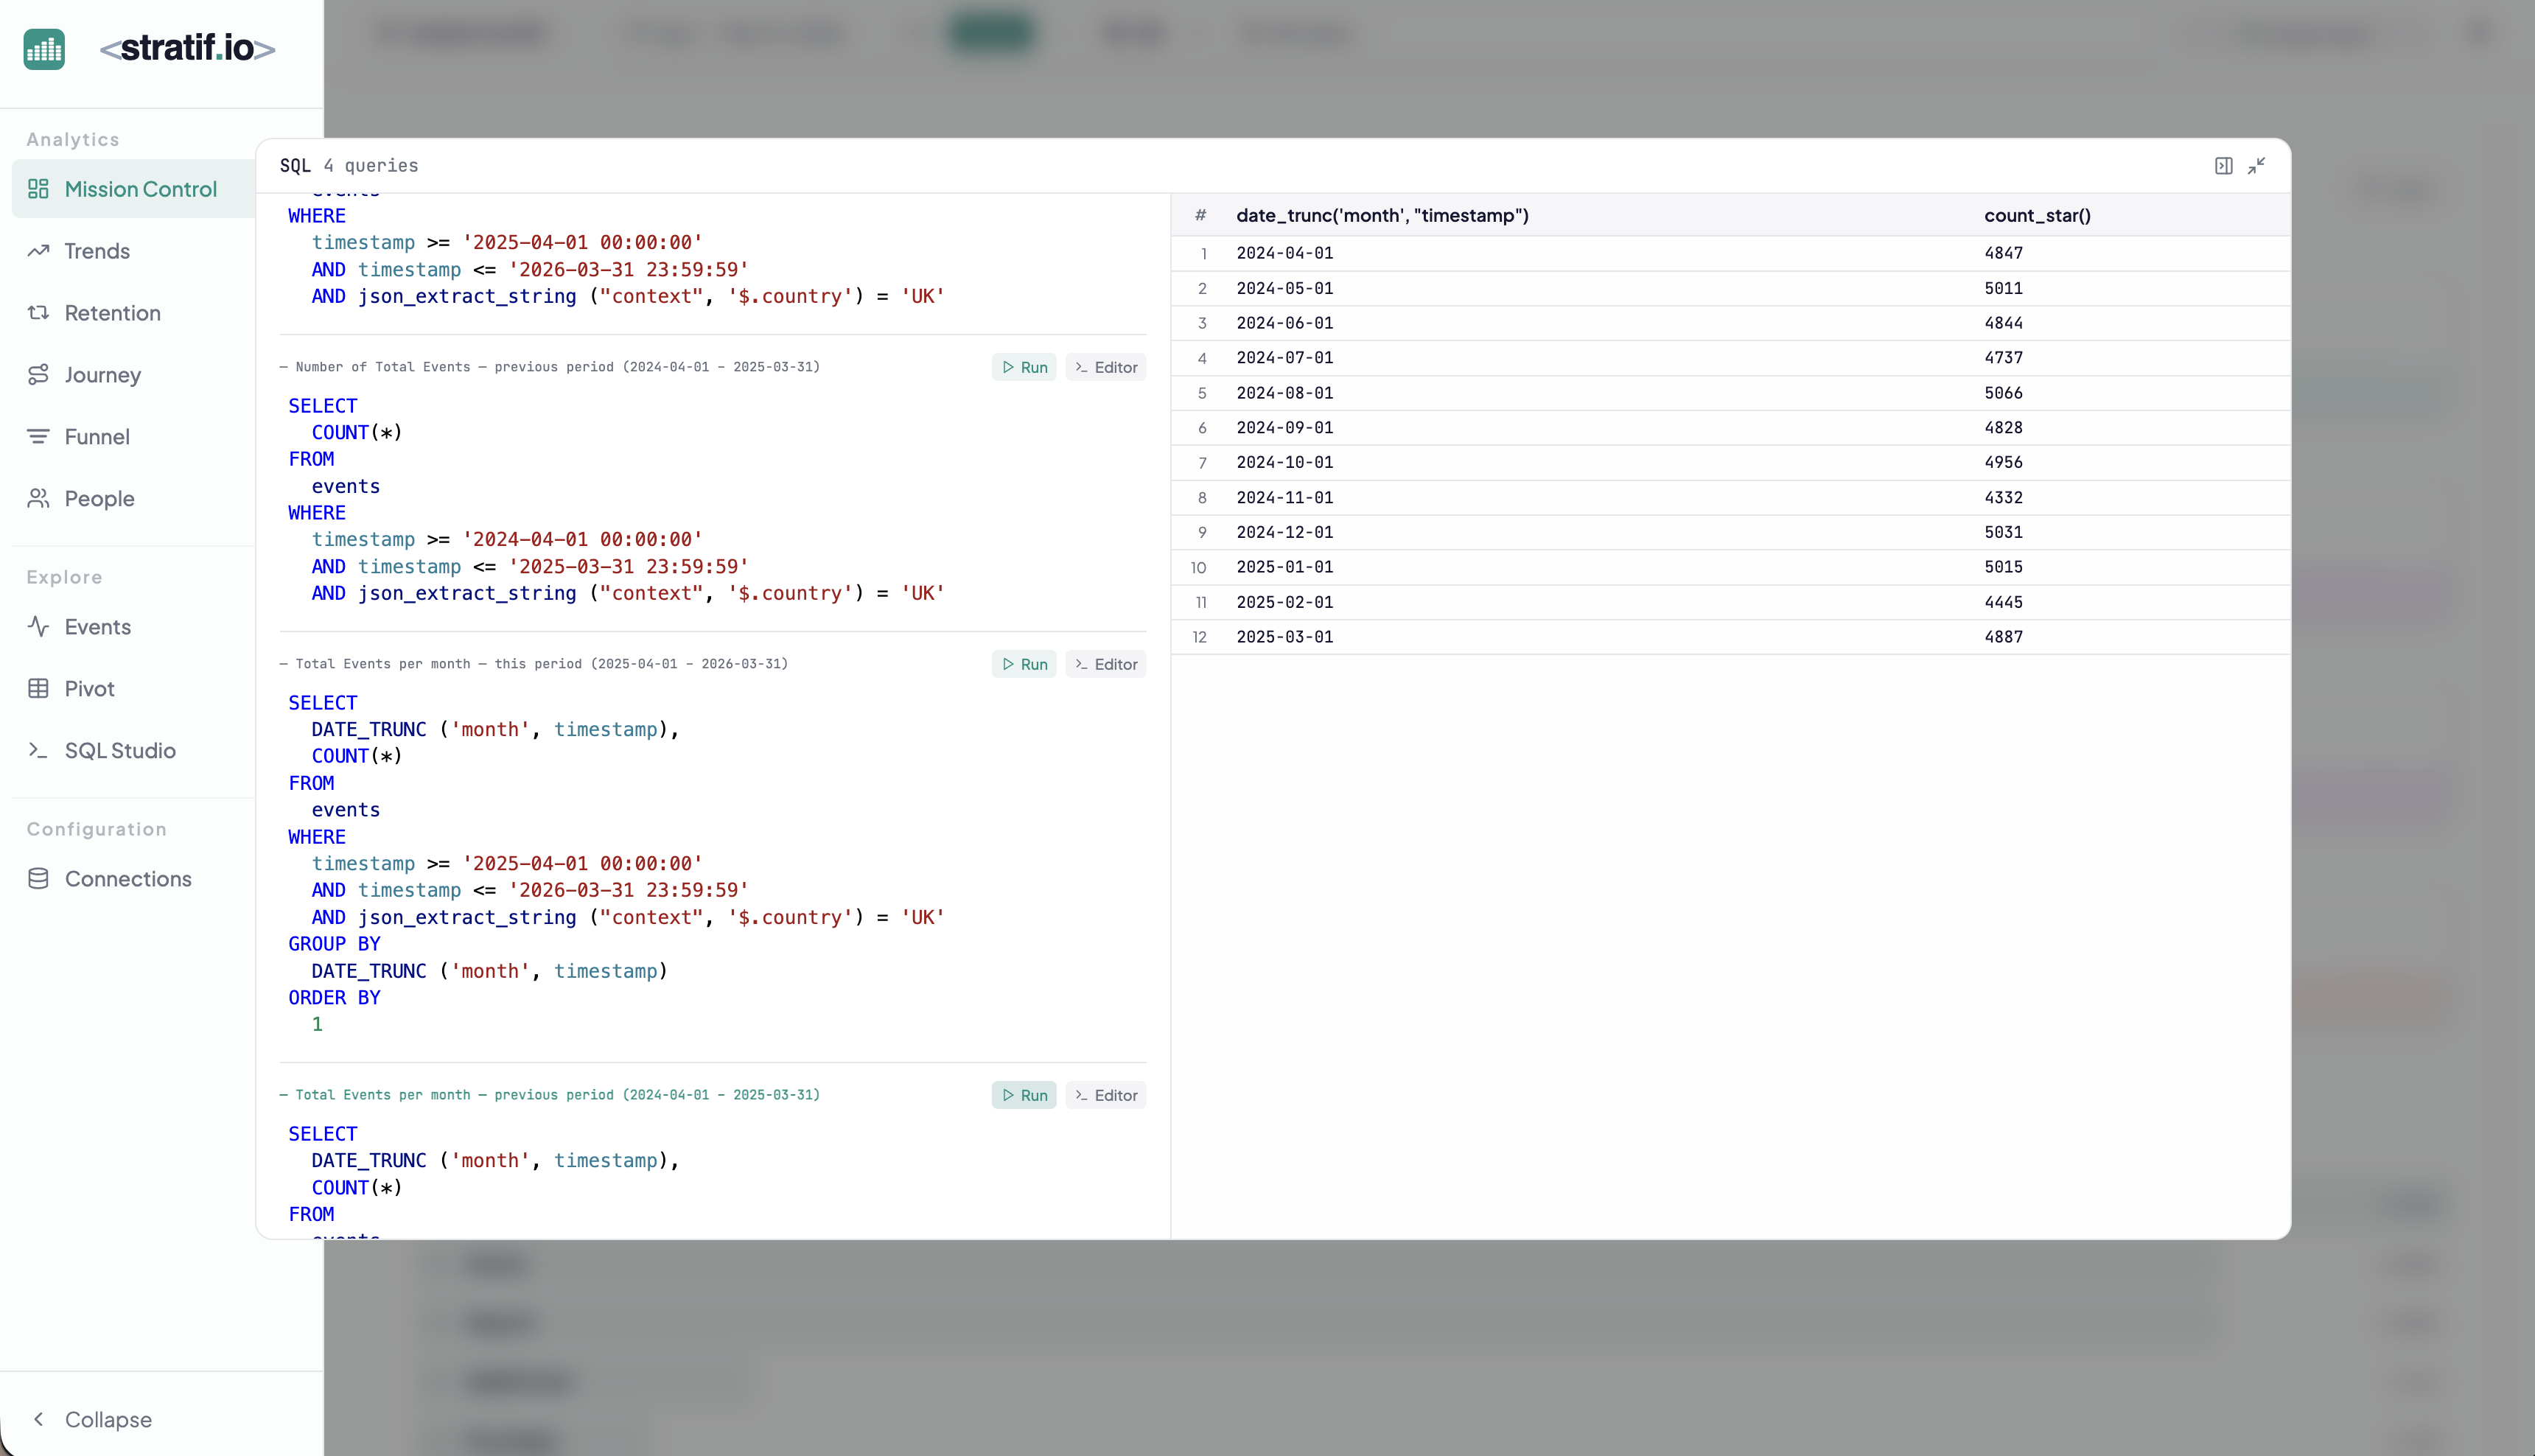
You can copy the query into SQL Studio to modify it, run variations, or use it as a starting point for your own analysis. This makes stratif.io a learning tool as much as an analytics tool: you can see how product metrics are actually computed in SQL, not just consume the results.