Mission Control — Product Analytics Dashboard
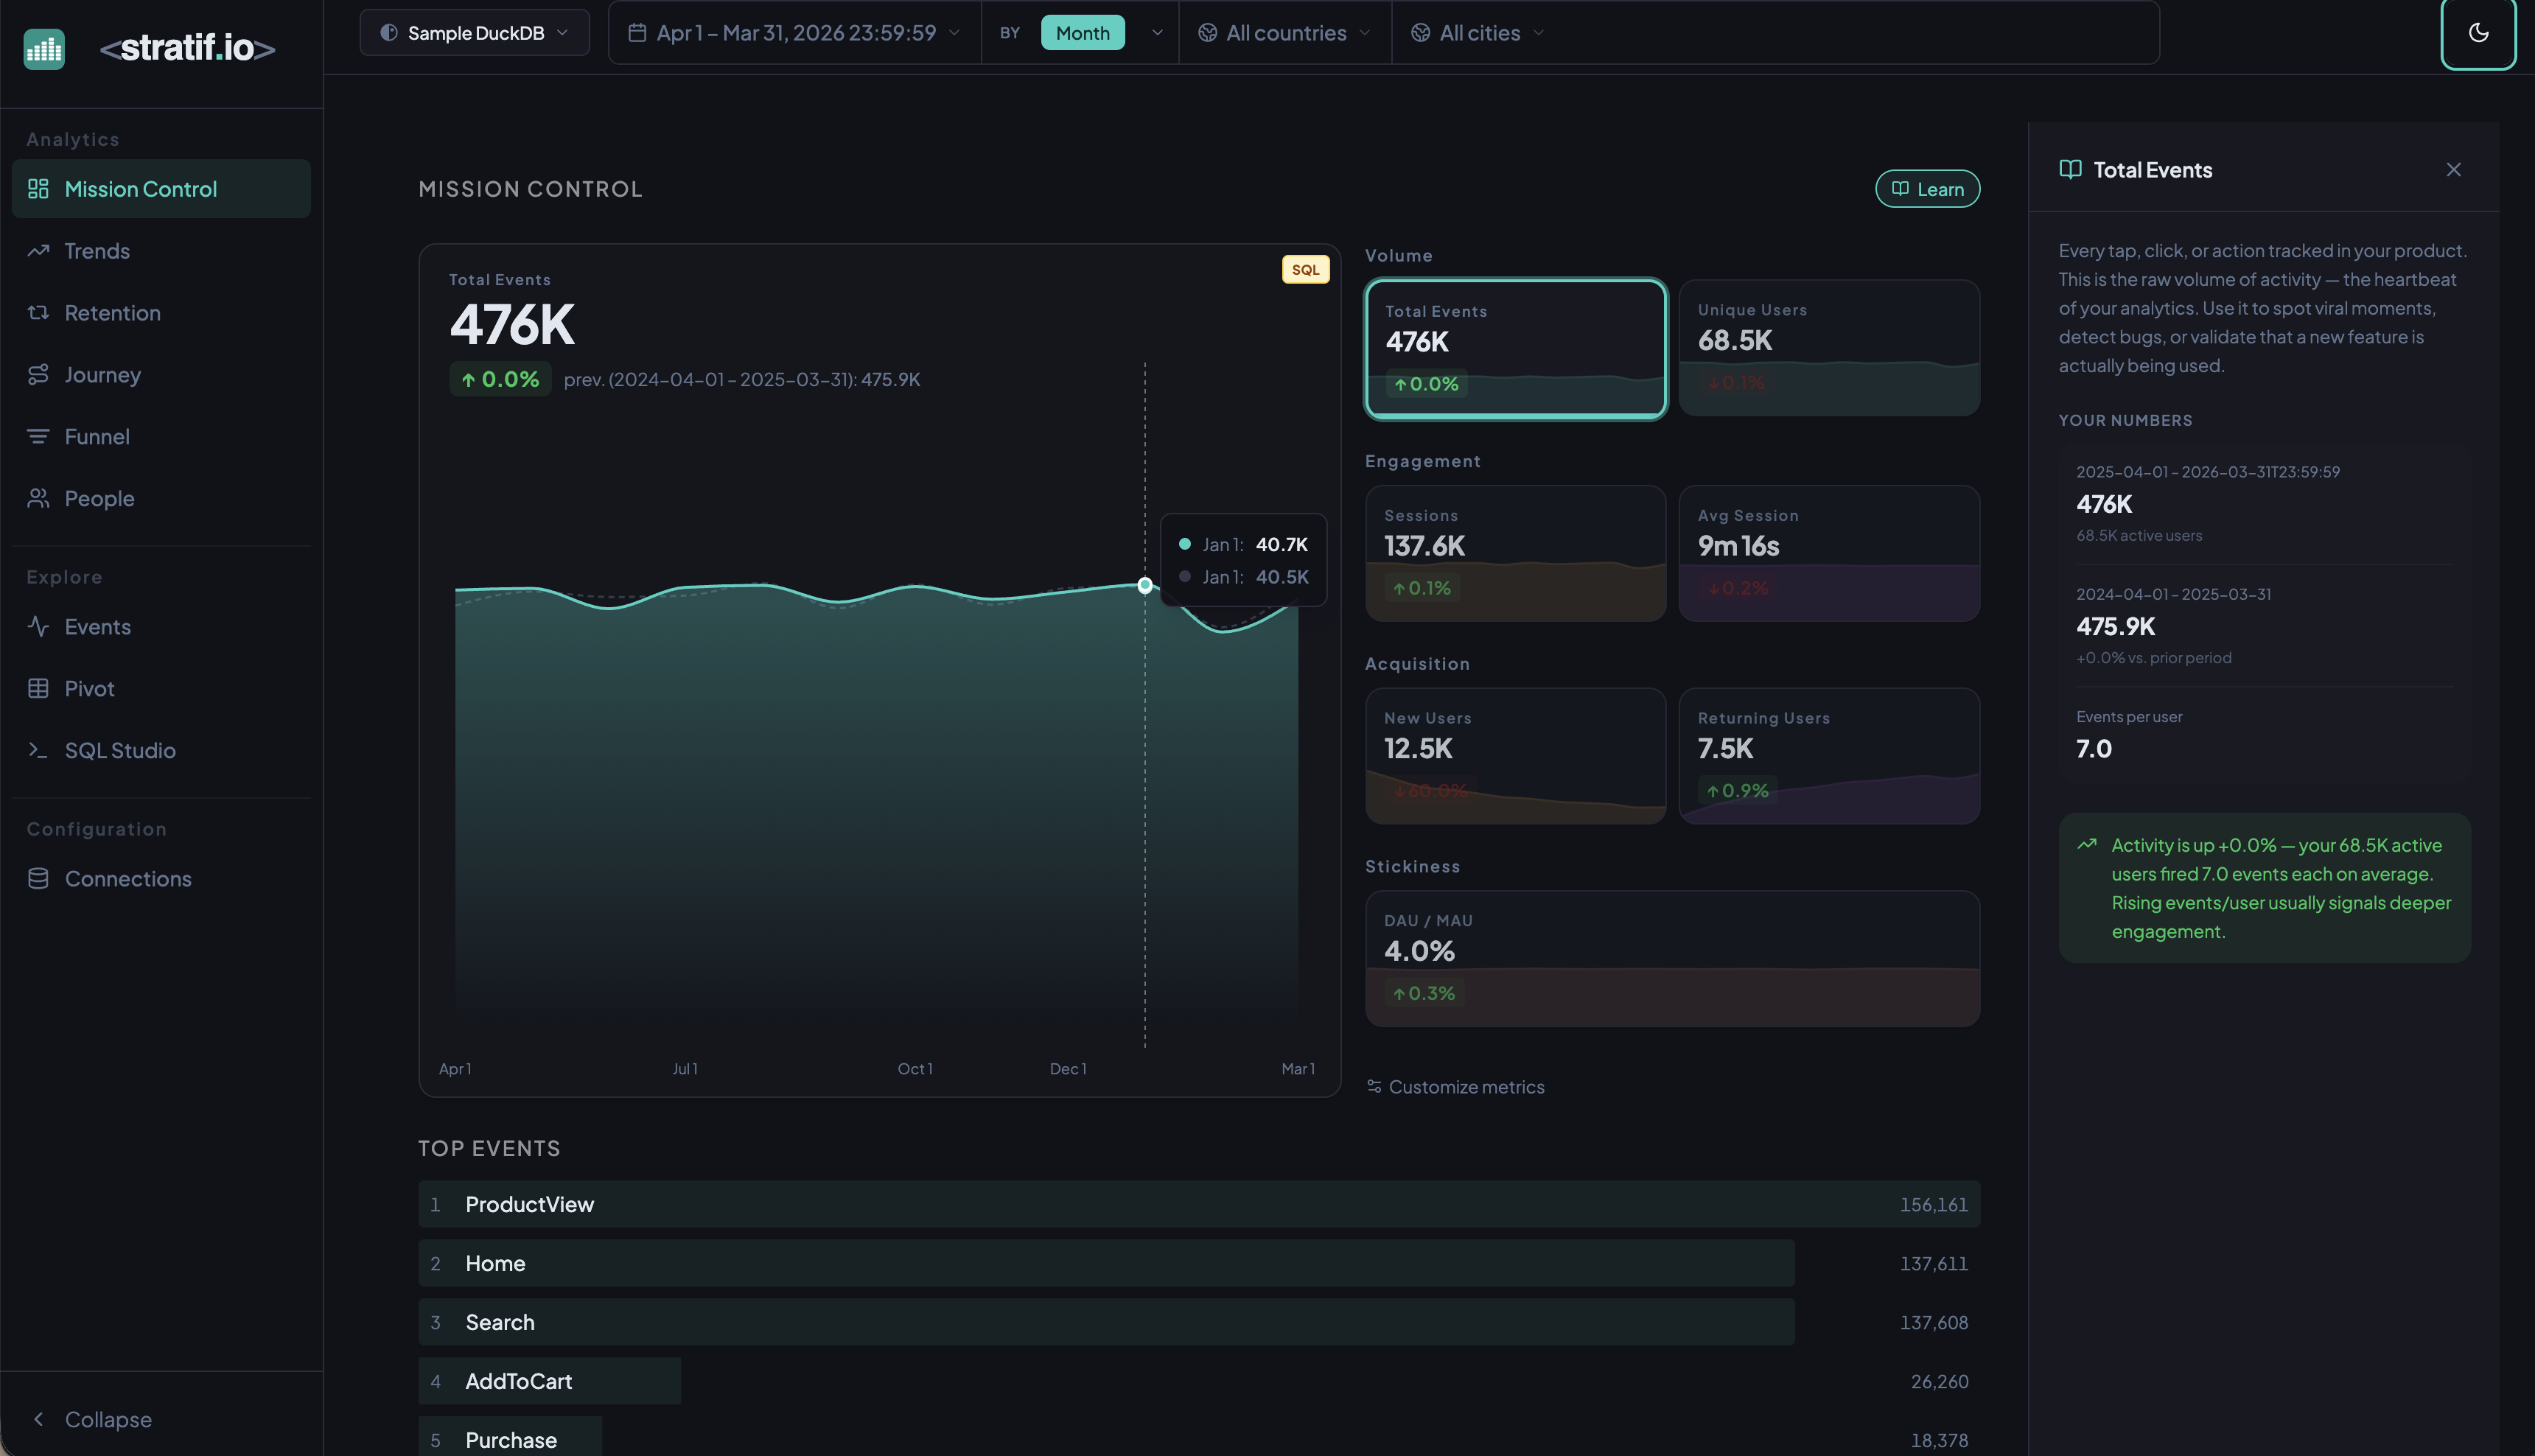
Mission Control is the home page of stratif.io. It gives you a single-screen overview of the health of your product across four dimensions: how much activity is happening, how engaged users are, whether you’re acquiring new users, and how sticky the product is.
Open it every morning before anything else. If something has changed significantly overnight, you’ll see it here before you get the Slack message.
Volume
Total Events — the raw count of all events fired in the selected time window. Every user action your product tracks — page views, clicks, form submissions, purchases — adds to this number. Total events is the heartbeat of your product. A sudden drop often means a tracking bug, a deployment regression, or a major user exodus. A sudden spike might mean a viral moment, a bot attack, or a successful campaign. Watch the trend, not just the absolute number.
Unique Users — the count of distinct user_id values in the period. This equals your Monthly Active Users (MAU) when the date range spans a full month. Total events can grow because existing users are doing more — or because you have more users. Unique Users separates the two.
Weekly Active Users (WAU) — distinct users who fired at least one event in the last 7 days of the selected period. WAU sits between the sensitivity of DAU and the smoothness of MAU, and catches weekly-cycle products (tools used on weekdays but not weekends) better than monthly figures.
Engagement
Sessions — a session is a group of events from the same user with no gap longer than 30 minutes (configurable in Advanced Options). Sessions tell you how often users come back and how long they stay engaged in a single sitting. A product with high unique users but low sessions per user is being opened and immediately abandoned.
Avg Session Duration — the average length of a session from first event to last. Duration is a double-edged signal: long sessions are good for content products but may indicate confusion in task-completion products. Know which type yours is before interpreting this number.
Events / Session — the average number of events fired within a single session. A low value combined with short duration signals shallow engagement — users land, look at one thing, and leave. Increasing events per session is often a more actionable goal than increasing duration.
Active Days — the average number of distinct calendar days a user was active during the period. Low average active days alongside healthy Unique Users can mean users try and then slow down — an early signal of disengagement before it shows up in churn.
Power Users — users active on at least N distinct days per period (N is the Power User Threshold, default 4). Power users disproportionately drive retention and word-of-mouth. A product where power users are a declining fraction of MAU is losing depth even as the headline count stays flat.
Acquisition
New Users — users whose earliest recorded event falls within the selected window. New users is your growth input. If it’s growing but retention is flat, you have a leaky bucket — you’re filling the tub while the drain is open.
Returning Users — users whose first event predates the window and who were also active in the previous period. A ratio of Returning to New shifting toward returning over time means the product is building habits and loyalty.
Resurrected Users — users who had been inactive longer than the Resurrection Window (default 30 days) and came back. Resurrections are a direct readout of win-back campaign effectiveness. Resurrected users often have lower long-term retention, so track whether they stick or churn again quickly.
Churned Users — users active in the previous equivalent period but absent in the current one. If New Users = 500 and Churned = 480, you’re on a treadmill — net growth of only 20 users despite significant acquisition. When churn approaches new acquisition, growth stalls.
Retention Rate — retained_users / prev_unique_users × 100. The single most predictive metric for long-term product health. A product with 70%+ monthly retention compounds — each cohort mostly stays. Below 20%, you have a fundamental engagement problem that acquisition cannot fix. The tooltip shows the raw counts so you can see the exact cohort.
Stickiness
DAU / MAU — Daily Active Users divided by Monthly Active Users, expressed as a percentage. Measures habit strength across the user base:
- < 5% — users rarely return within the month; low-habit or niche tool
- 10–20% — typical for weekly-use products (project management, analytics)
- 20–50% — strong engagement; users return multiple times per week
- > 50% — daily habit product (messaging, social media, daily dashboards)
stratif.io’s own benchmark for a healthy internal analytics tool is 20–30% DAU/MAU.
Top Events
The ranked list of the most frequently fired events in the period. Each row shows the event name and its total count. Top Events tells you what users are actually doing, not what you designed them to do. If Search appears five times more than Purchase, users are searching but not converting. This list is a fast gut-check on user behaviour.
Customise metrics
Click Customize metrics at the bottom of the panel to pin or unpin metric cards. The default view shows Total Events, Unique Users, Sessions, Avg Session Duration, New Users, Returning Users, and DAU/MAU — but every metric described above is available.
View the SQL
Every metric and chart on this page has a SQL badge. Click it to open the exact query stratif.io ran against your warehouse to produce that number — joins, window functions, filters and all.
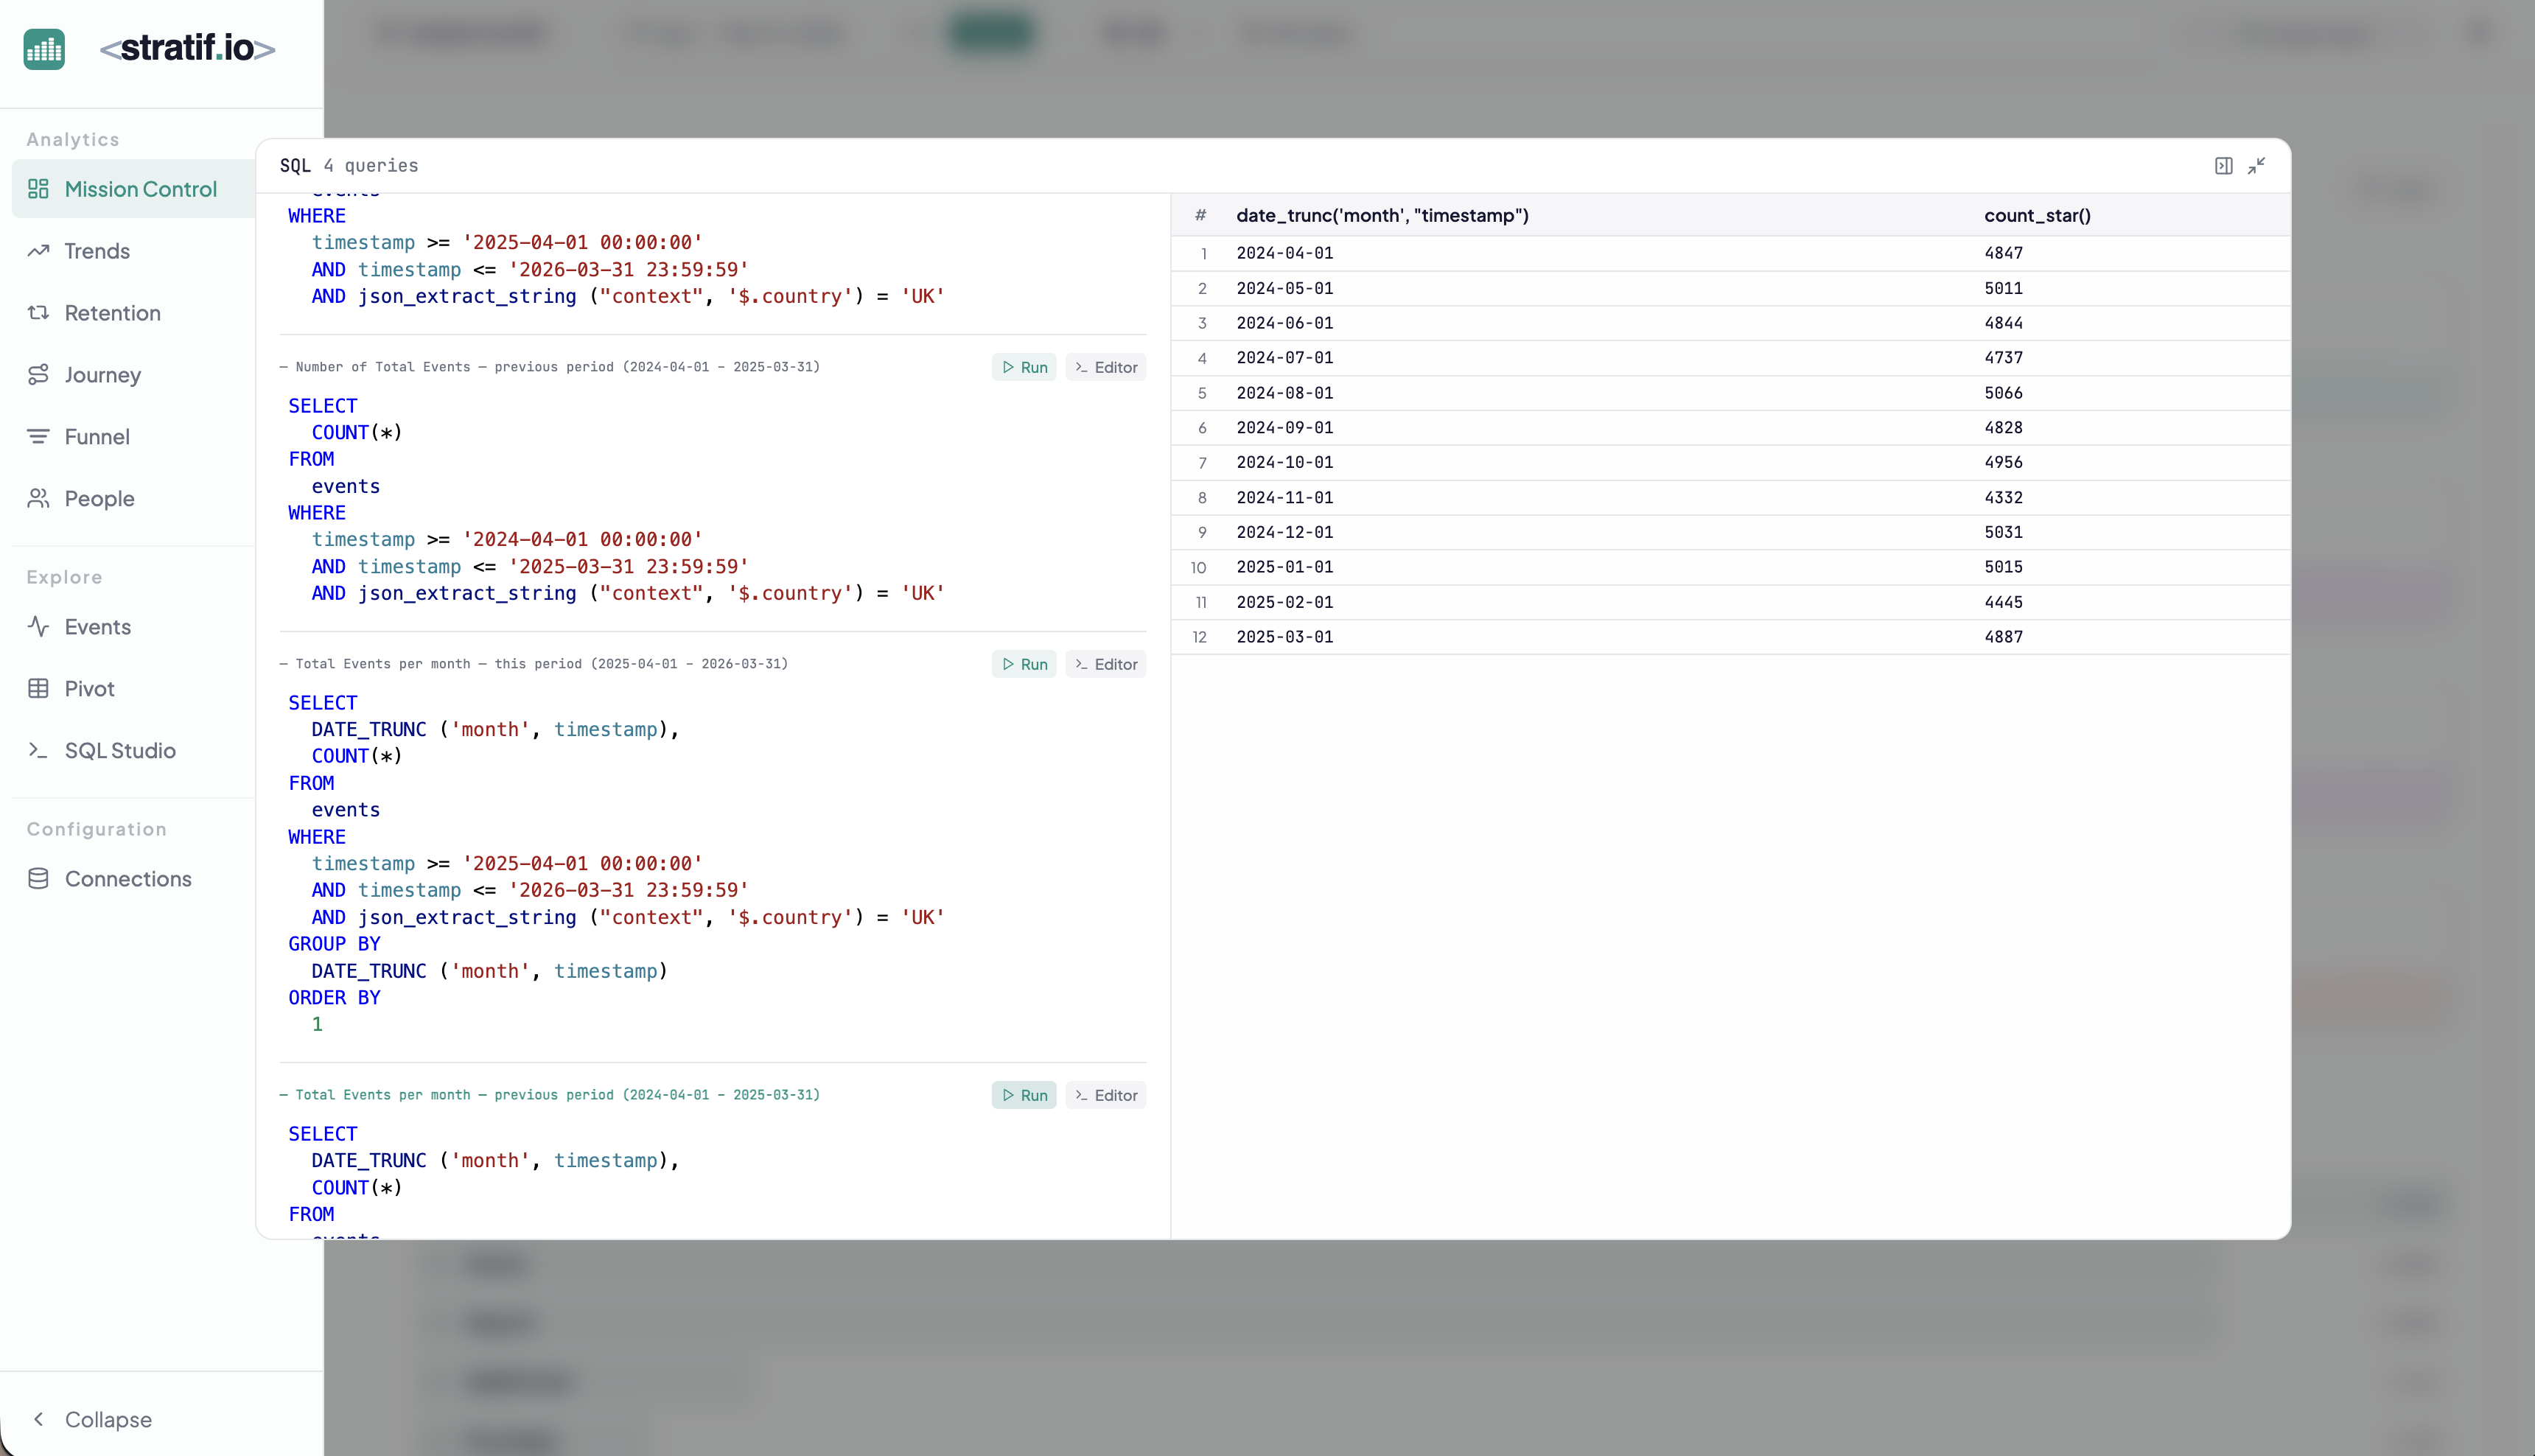
You can copy the query into SQL Studio to modify it, run variations, or use it as a starting point for your own analysis.