Events Explorer — Inspect Raw Warehouse Events
Events Explorer gives you direct access to the raw rows in your events table — the ground truth underneath every chart and metric.
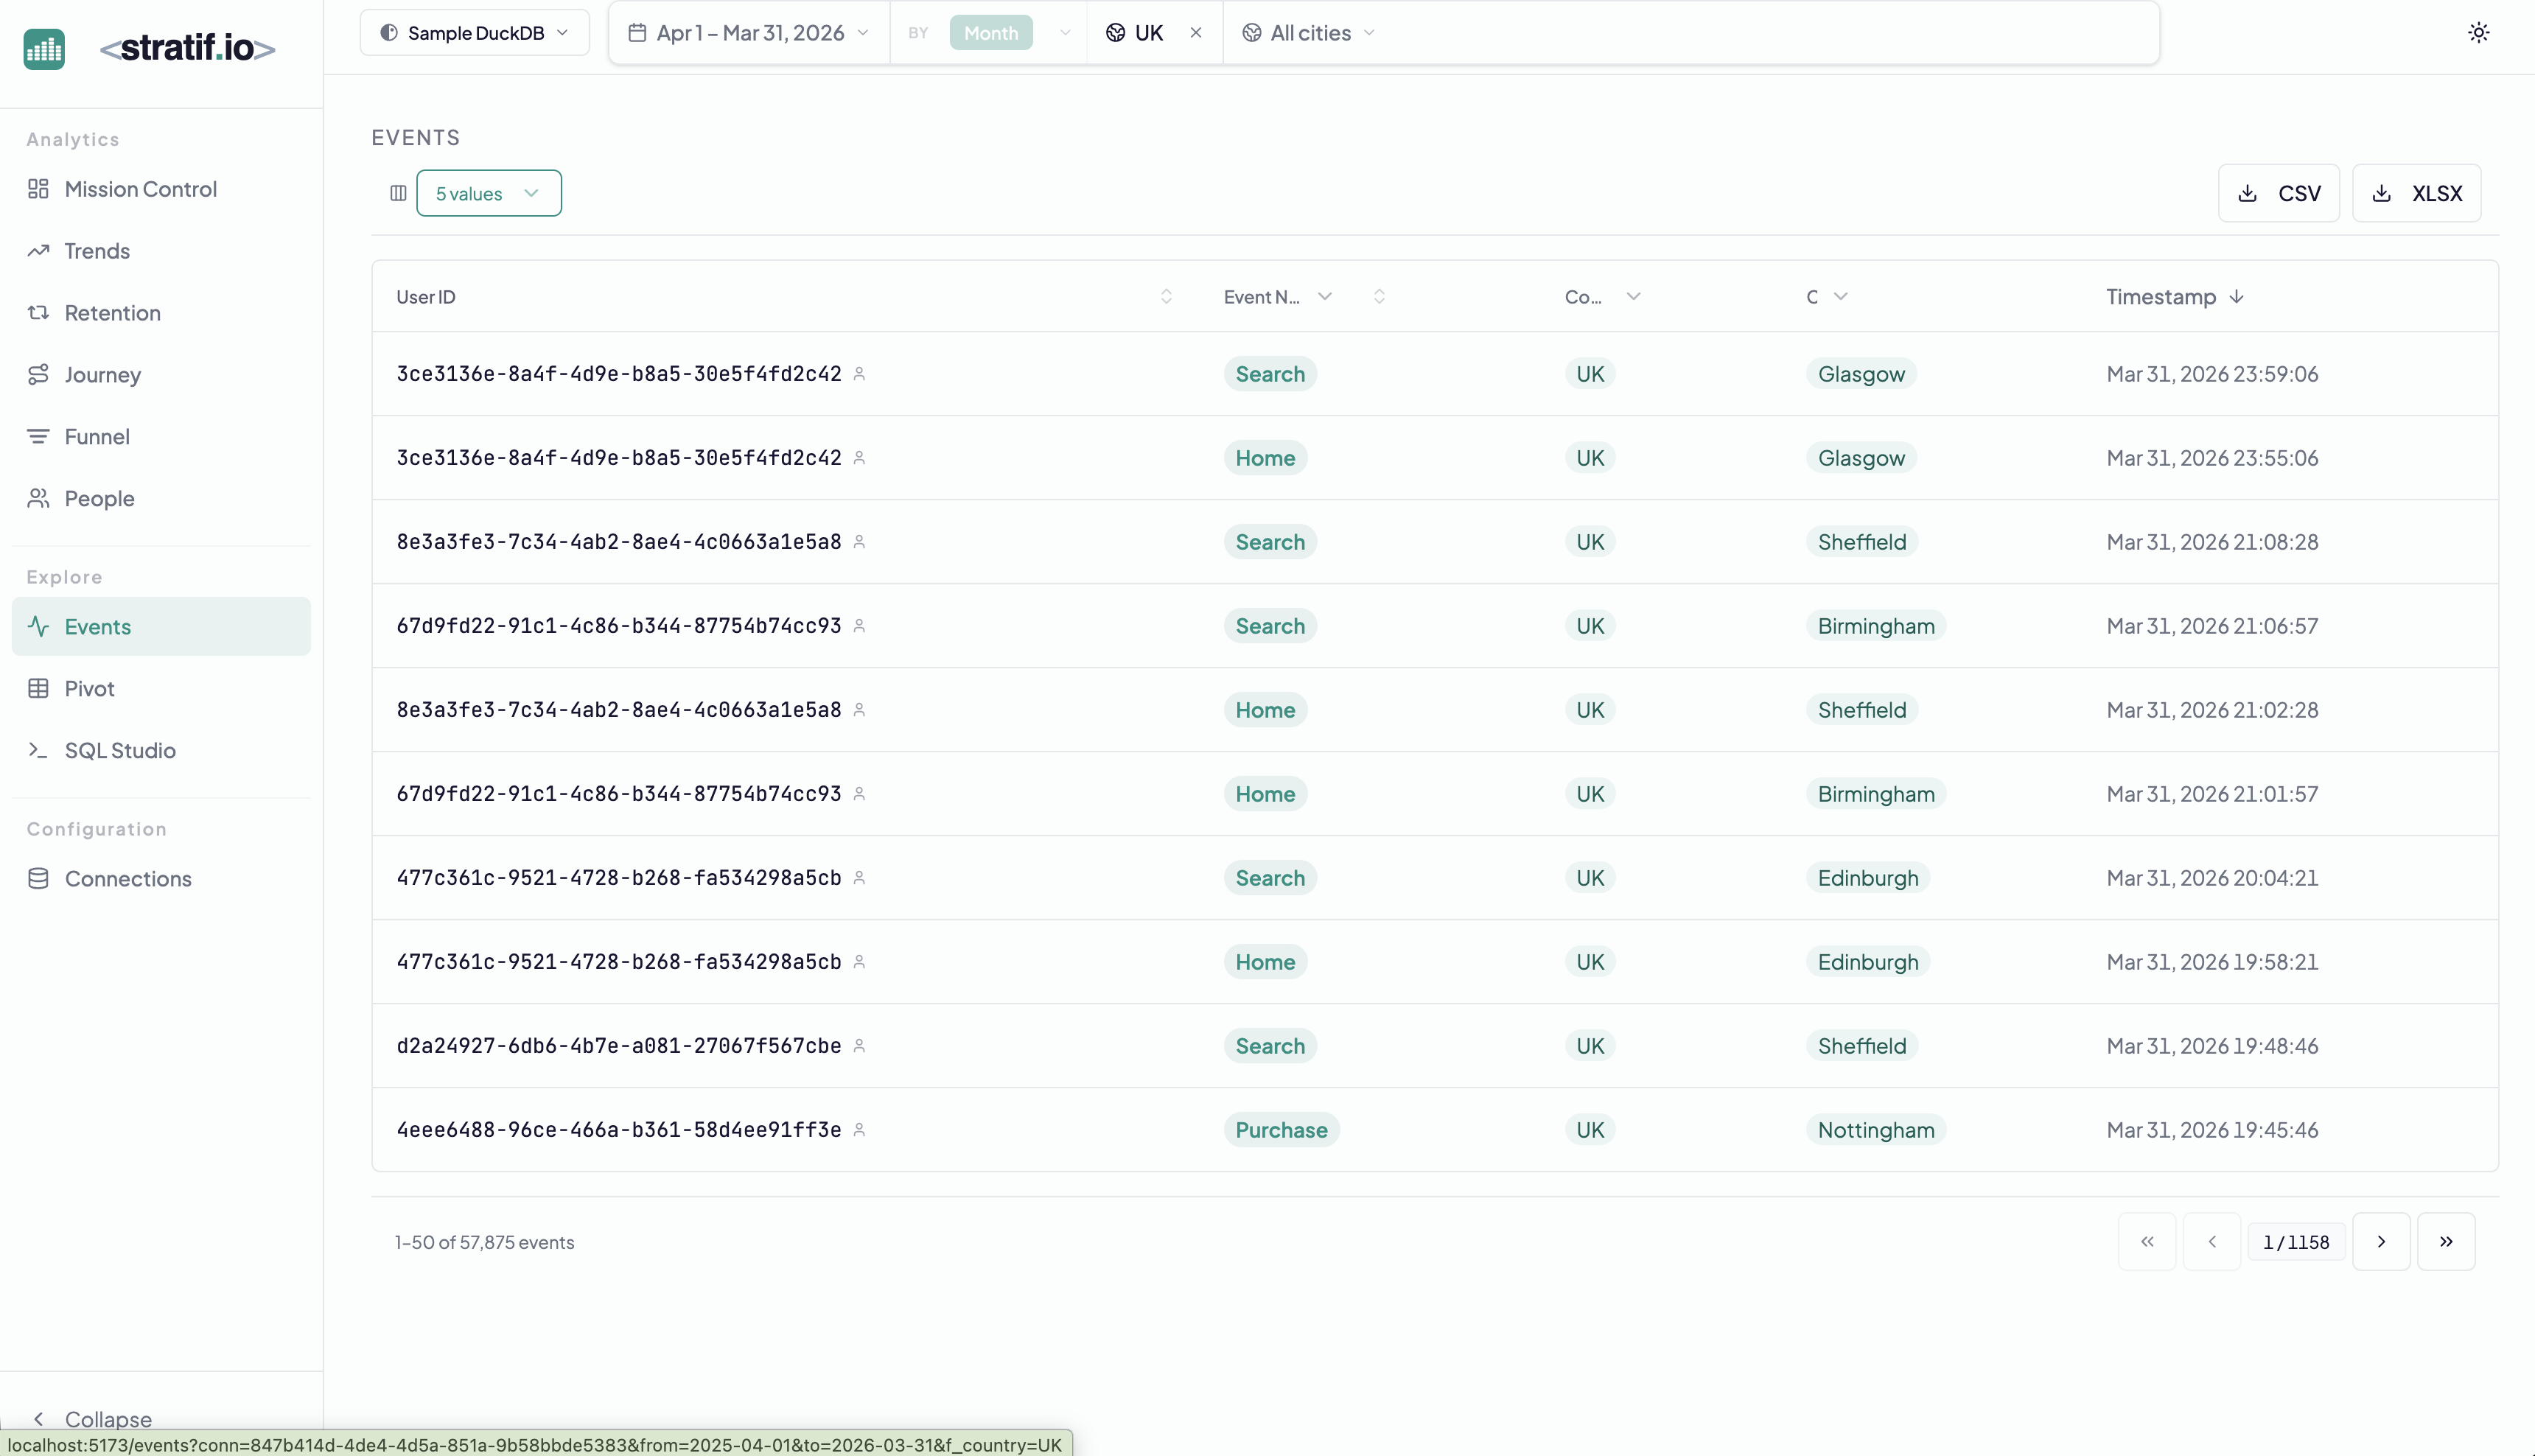
What you see
Each row is a single event record from your warehouse:
- User ID — the user who fired the event
- Event Name — what happened (Search, Home, Purchase, etc.)
- Country / City — location properties if present
- Timestamp — the exact moment the event was recorded
The 5 values chip at the top controls how many property columns are shown alongside the core fields.
Filtering and search
Global filters apply here too. Add a date range, a country filter, or a specific event type to narrow the stream. The row count updates to show how many events match.
Export
Click CSV or XLSX to export the filtered event stream directly from your warehouse. Useful for ad-hoc analysis in spreadsheets or feeding into other tools.
When to use Events Explorer
- Verify tracking: after deploying new event instrumentation, check that events are arriving with the right properties
- Debug anomalies: when a metric looks wrong, inspect the raw events that feed it
- Data quality: spot unexpected event names, missing properties, or malformed user IDs before they corrupt your aggregate metrics
View the SQL
Every metric and chart on this page has a SQL badge. Click it to open the exact query stratif.io ran against your warehouse to produce that number — joins, window functions, filters and all.
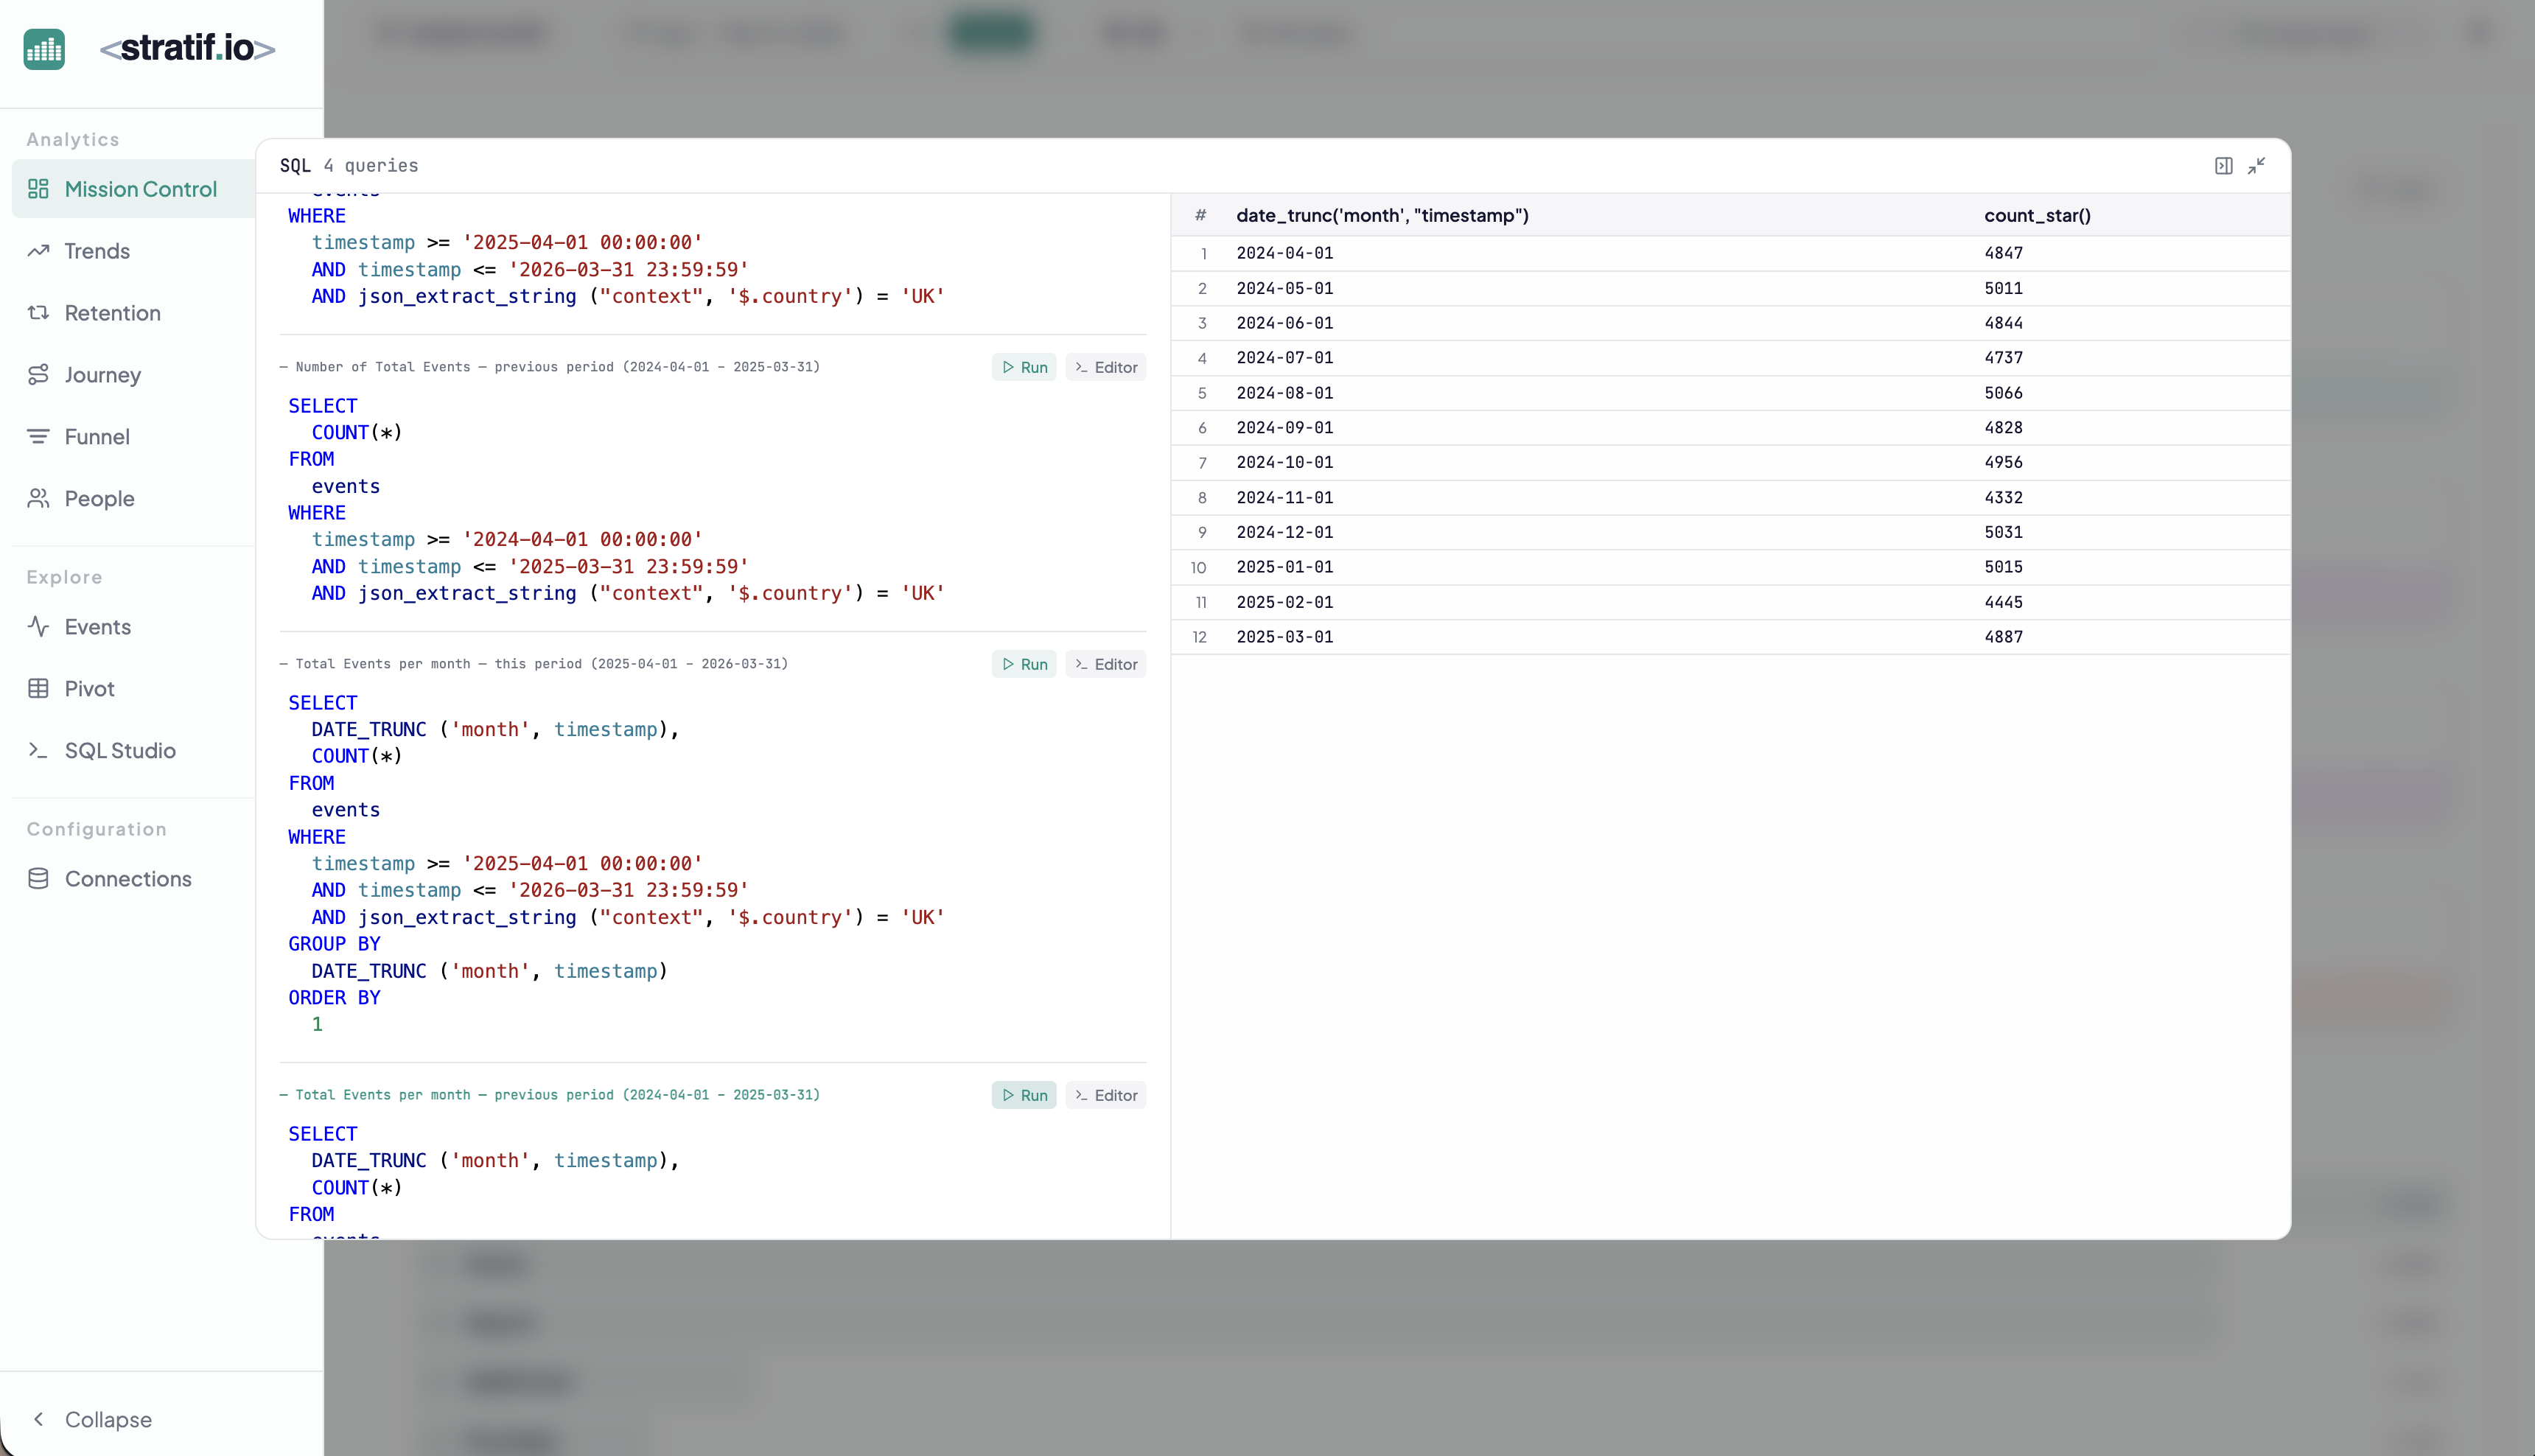
You can copy the query into SQL Studio to modify it, run variations, or use it as a starting point for your own analysis. This makes stratif.io a learning tool as much as an analytics tool: you can see how product metrics are actually computed in SQL, not just consume the results.