User Journey and Path Analysis — stratif.io
Paths answers: what do users actually do, in what order? Unlike funnels — which test a predefined sequence — paths discover sequences from your data.
How paths work
stratif.io groups events into sessions, then counts every unique sequence of events that appears. The result is a ranked list of the most common user journeys.
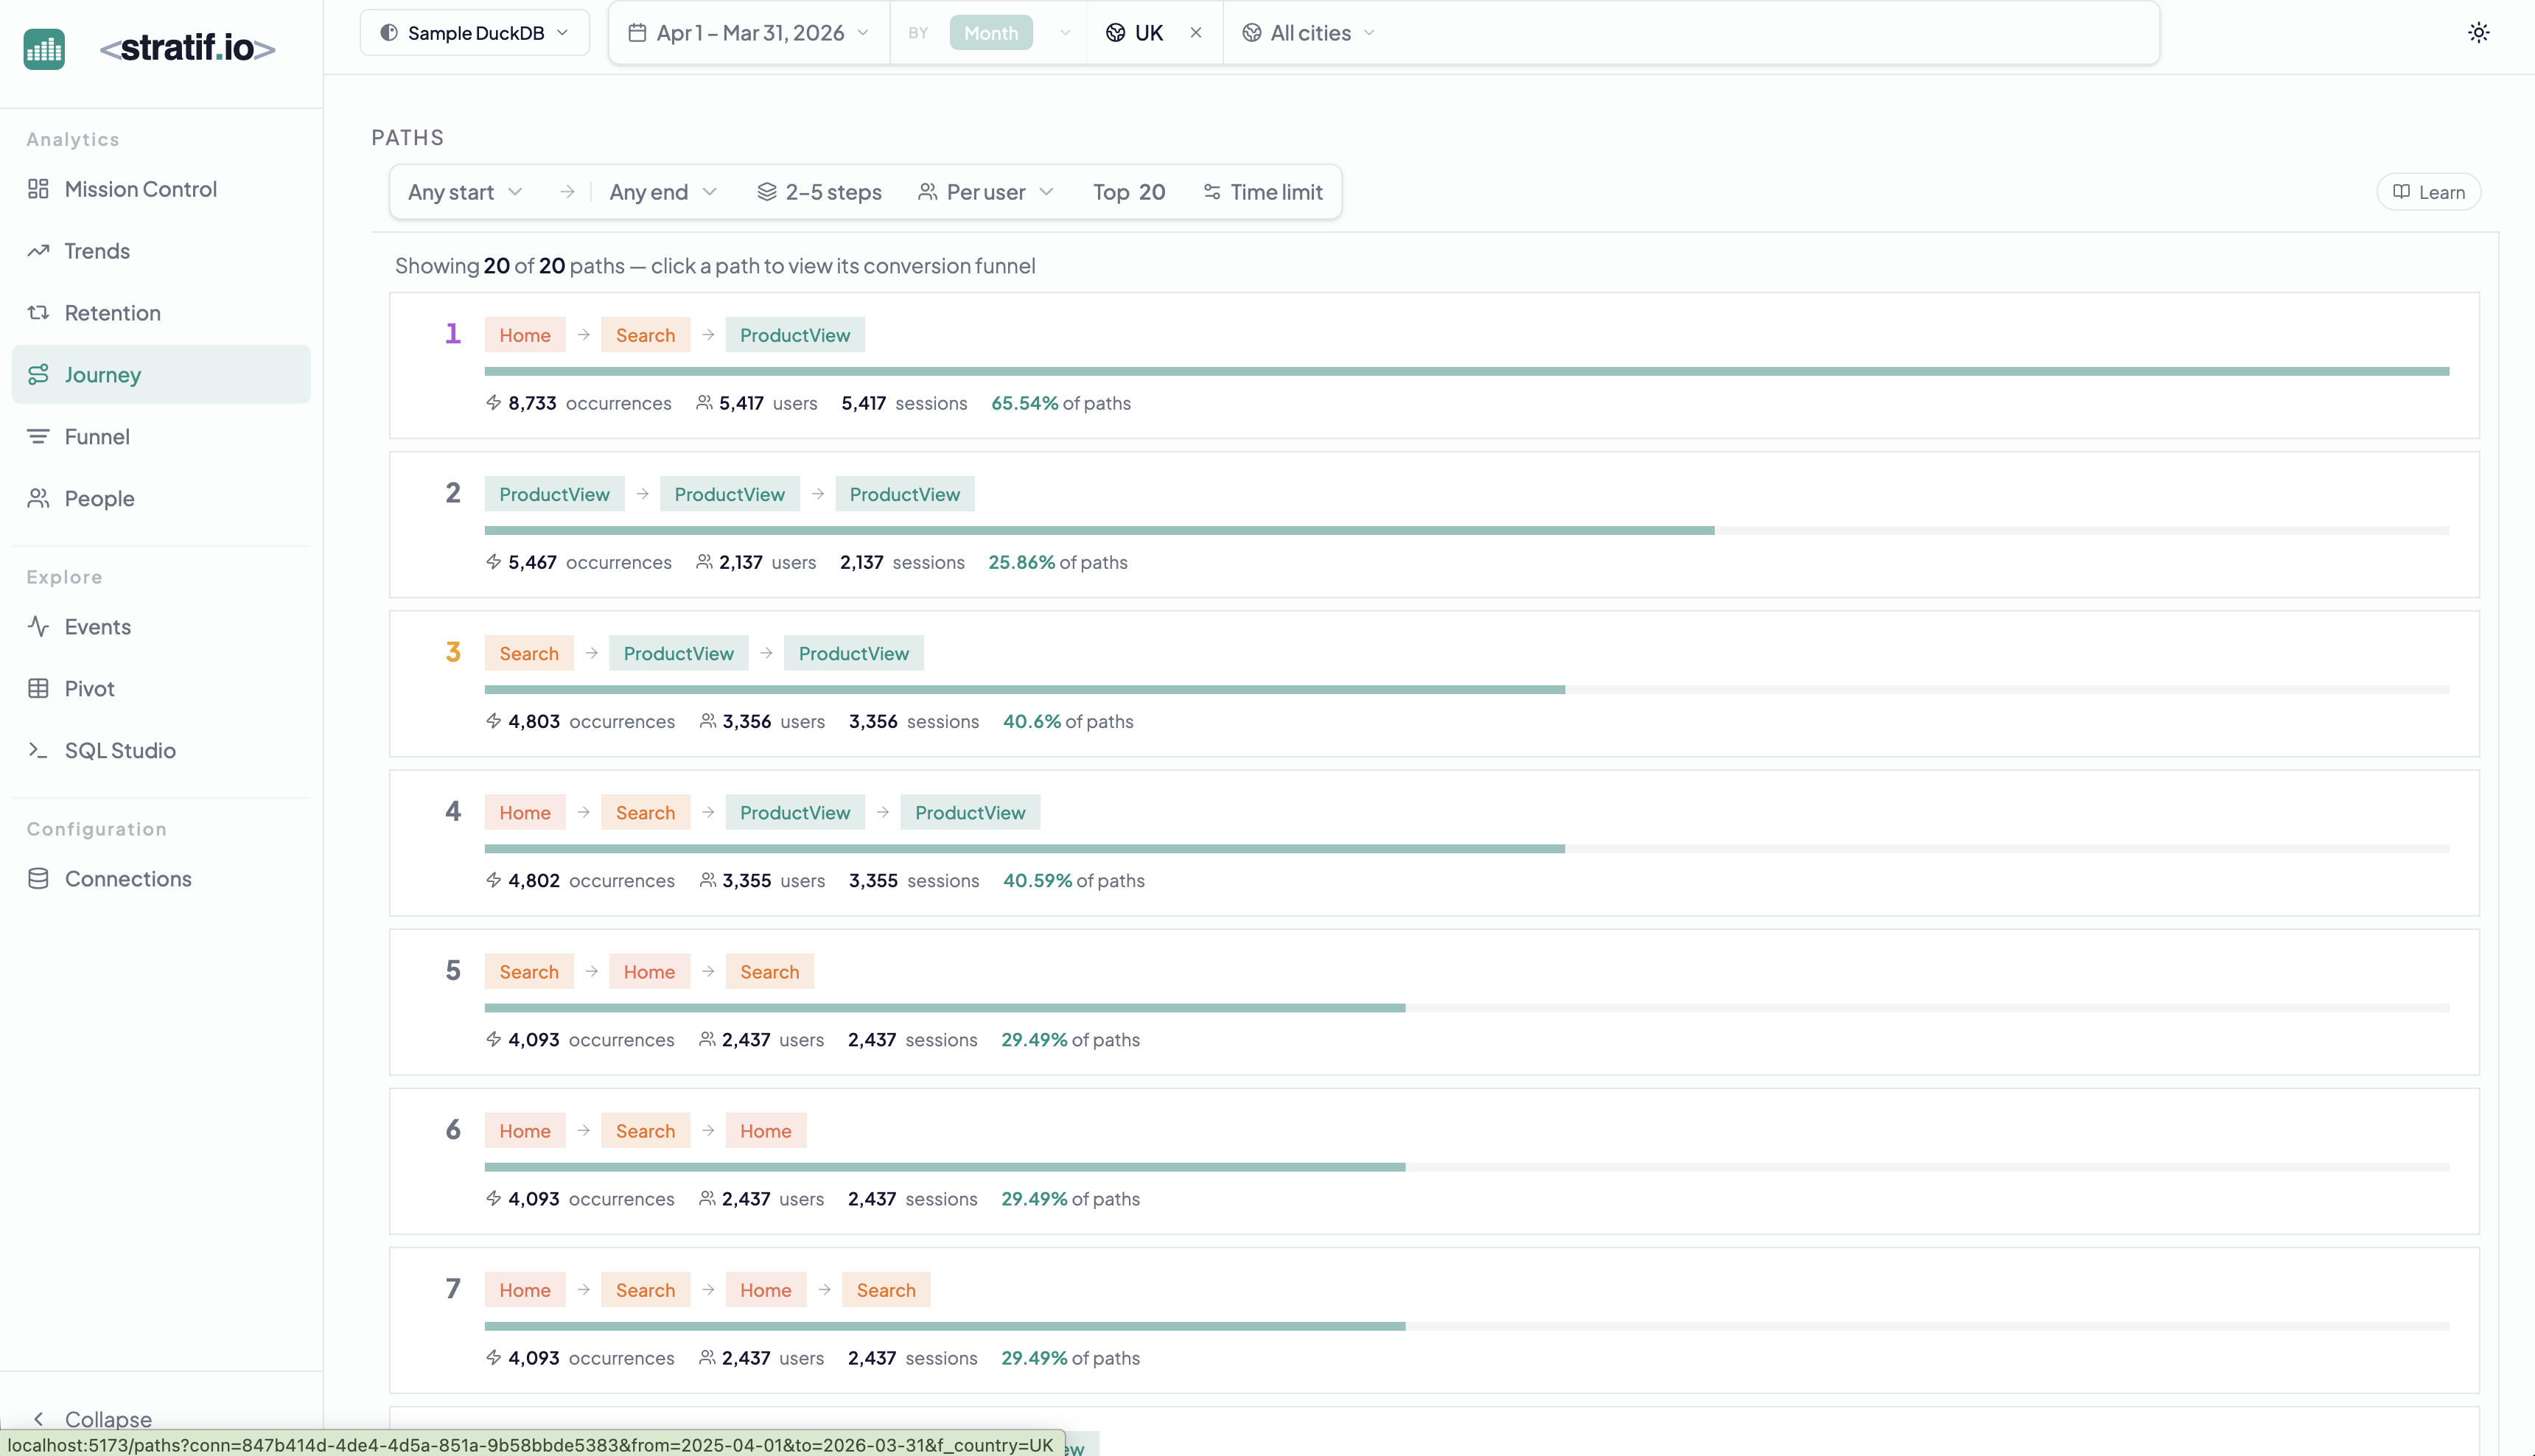
Each row shows:
- The sequence — the ordered chain of event names
- Occurrences — how many times this exact sequence appeared
- Users — how many distinct users followed it
- Sessions — how many sessions contained it
- % of paths — what share of all paths this sequence represents
Start and end anchors
Use Any start and Any end to discover paths freely. Or anchor one end — “paths that start with AddToCart” shows you everything users did after putting something in the cart. “Paths that end with Purchase” shows you the routes that led to conversion.
Step range filter
The 2–5 steps filter controls the minimum and maximum length of paths shown. Short paths (2 steps) reveal common two-event interactions. Longer paths (5+ steps) reveal power-user workflows.
Clicking a path
Click any path row to view its conversion funnel — how many of the users who started this path completed it, and where they dropped off.
Why paths matter
Funnels tell you where users drop off on a path you designed. Paths tell you what path users actually take. The difference is often surprising. You might discover that 25% of users reach checkout via a route that bypasses your main navigation — meaning your “optimised” funnel analysis was missing a quarter of your conversions. Paths surface these surprises.
View the SQL
Every metric and chart on this page has a SQL badge. Click it to open the exact query stratif.io ran against your warehouse to produce that number — joins, window functions, filters and all.
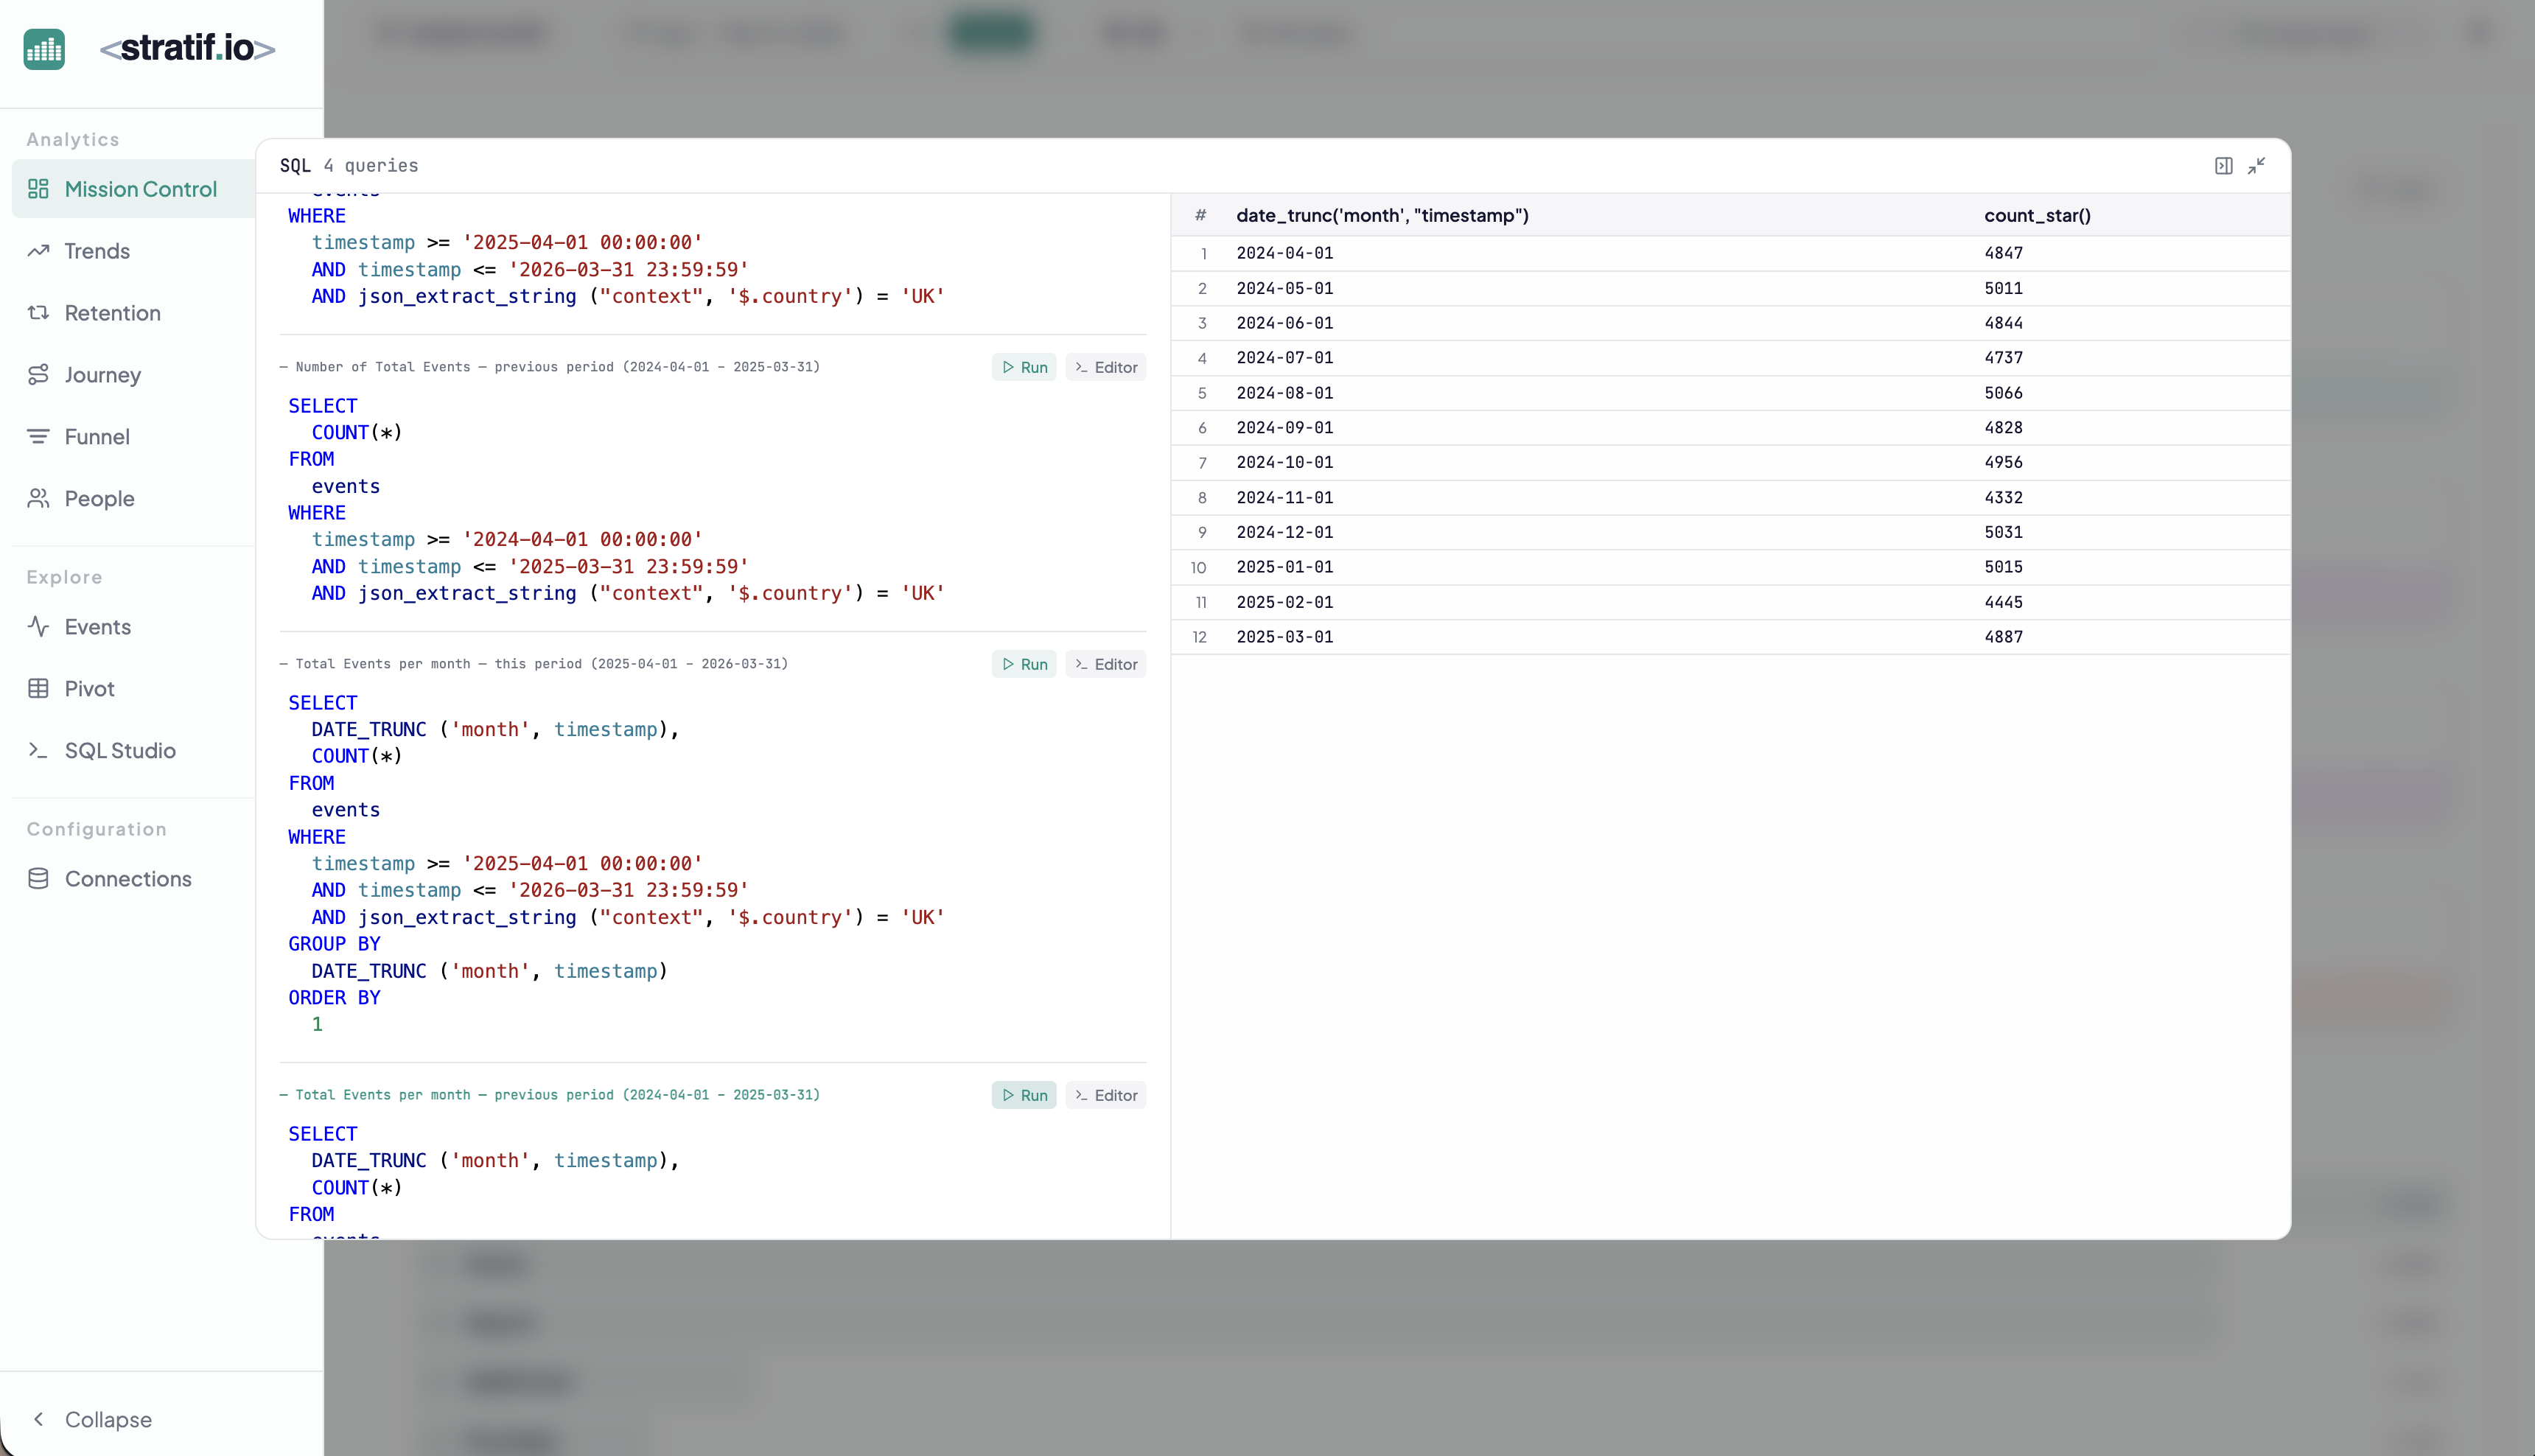
You can copy the query into SQL Studio to modify it, run variations, or use it as a starting point for your own analysis. This makes stratif.io a learning tool as much as an analytics tool: you can see how product metrics are actually computed in SQL, not just consume the results.