stratif.io is an open-source product analytics dashboard that queries your data warehouse directly — no event pipelines to maintain, no vendor lock-in, no per-event pricing. Connect it to DuckDB, PostgreSQL, ClickHouse, Snowflake, or Databricks and start exploring in minutes.
How it works
stratif.io runs as a lightweight server alongside your warehouse. You configure a connection, write (or let stratif.io generate) the SQL that defines your events, and every chart, funnel, and retention table executes a live query against your data. There is no intermediate storage and no ingestion delay — the numbers you see are always up to date.
Every metric ships with a SQL viewer so you can inspect the exact query behind any chart, adapt it, or run it yourself.
Features
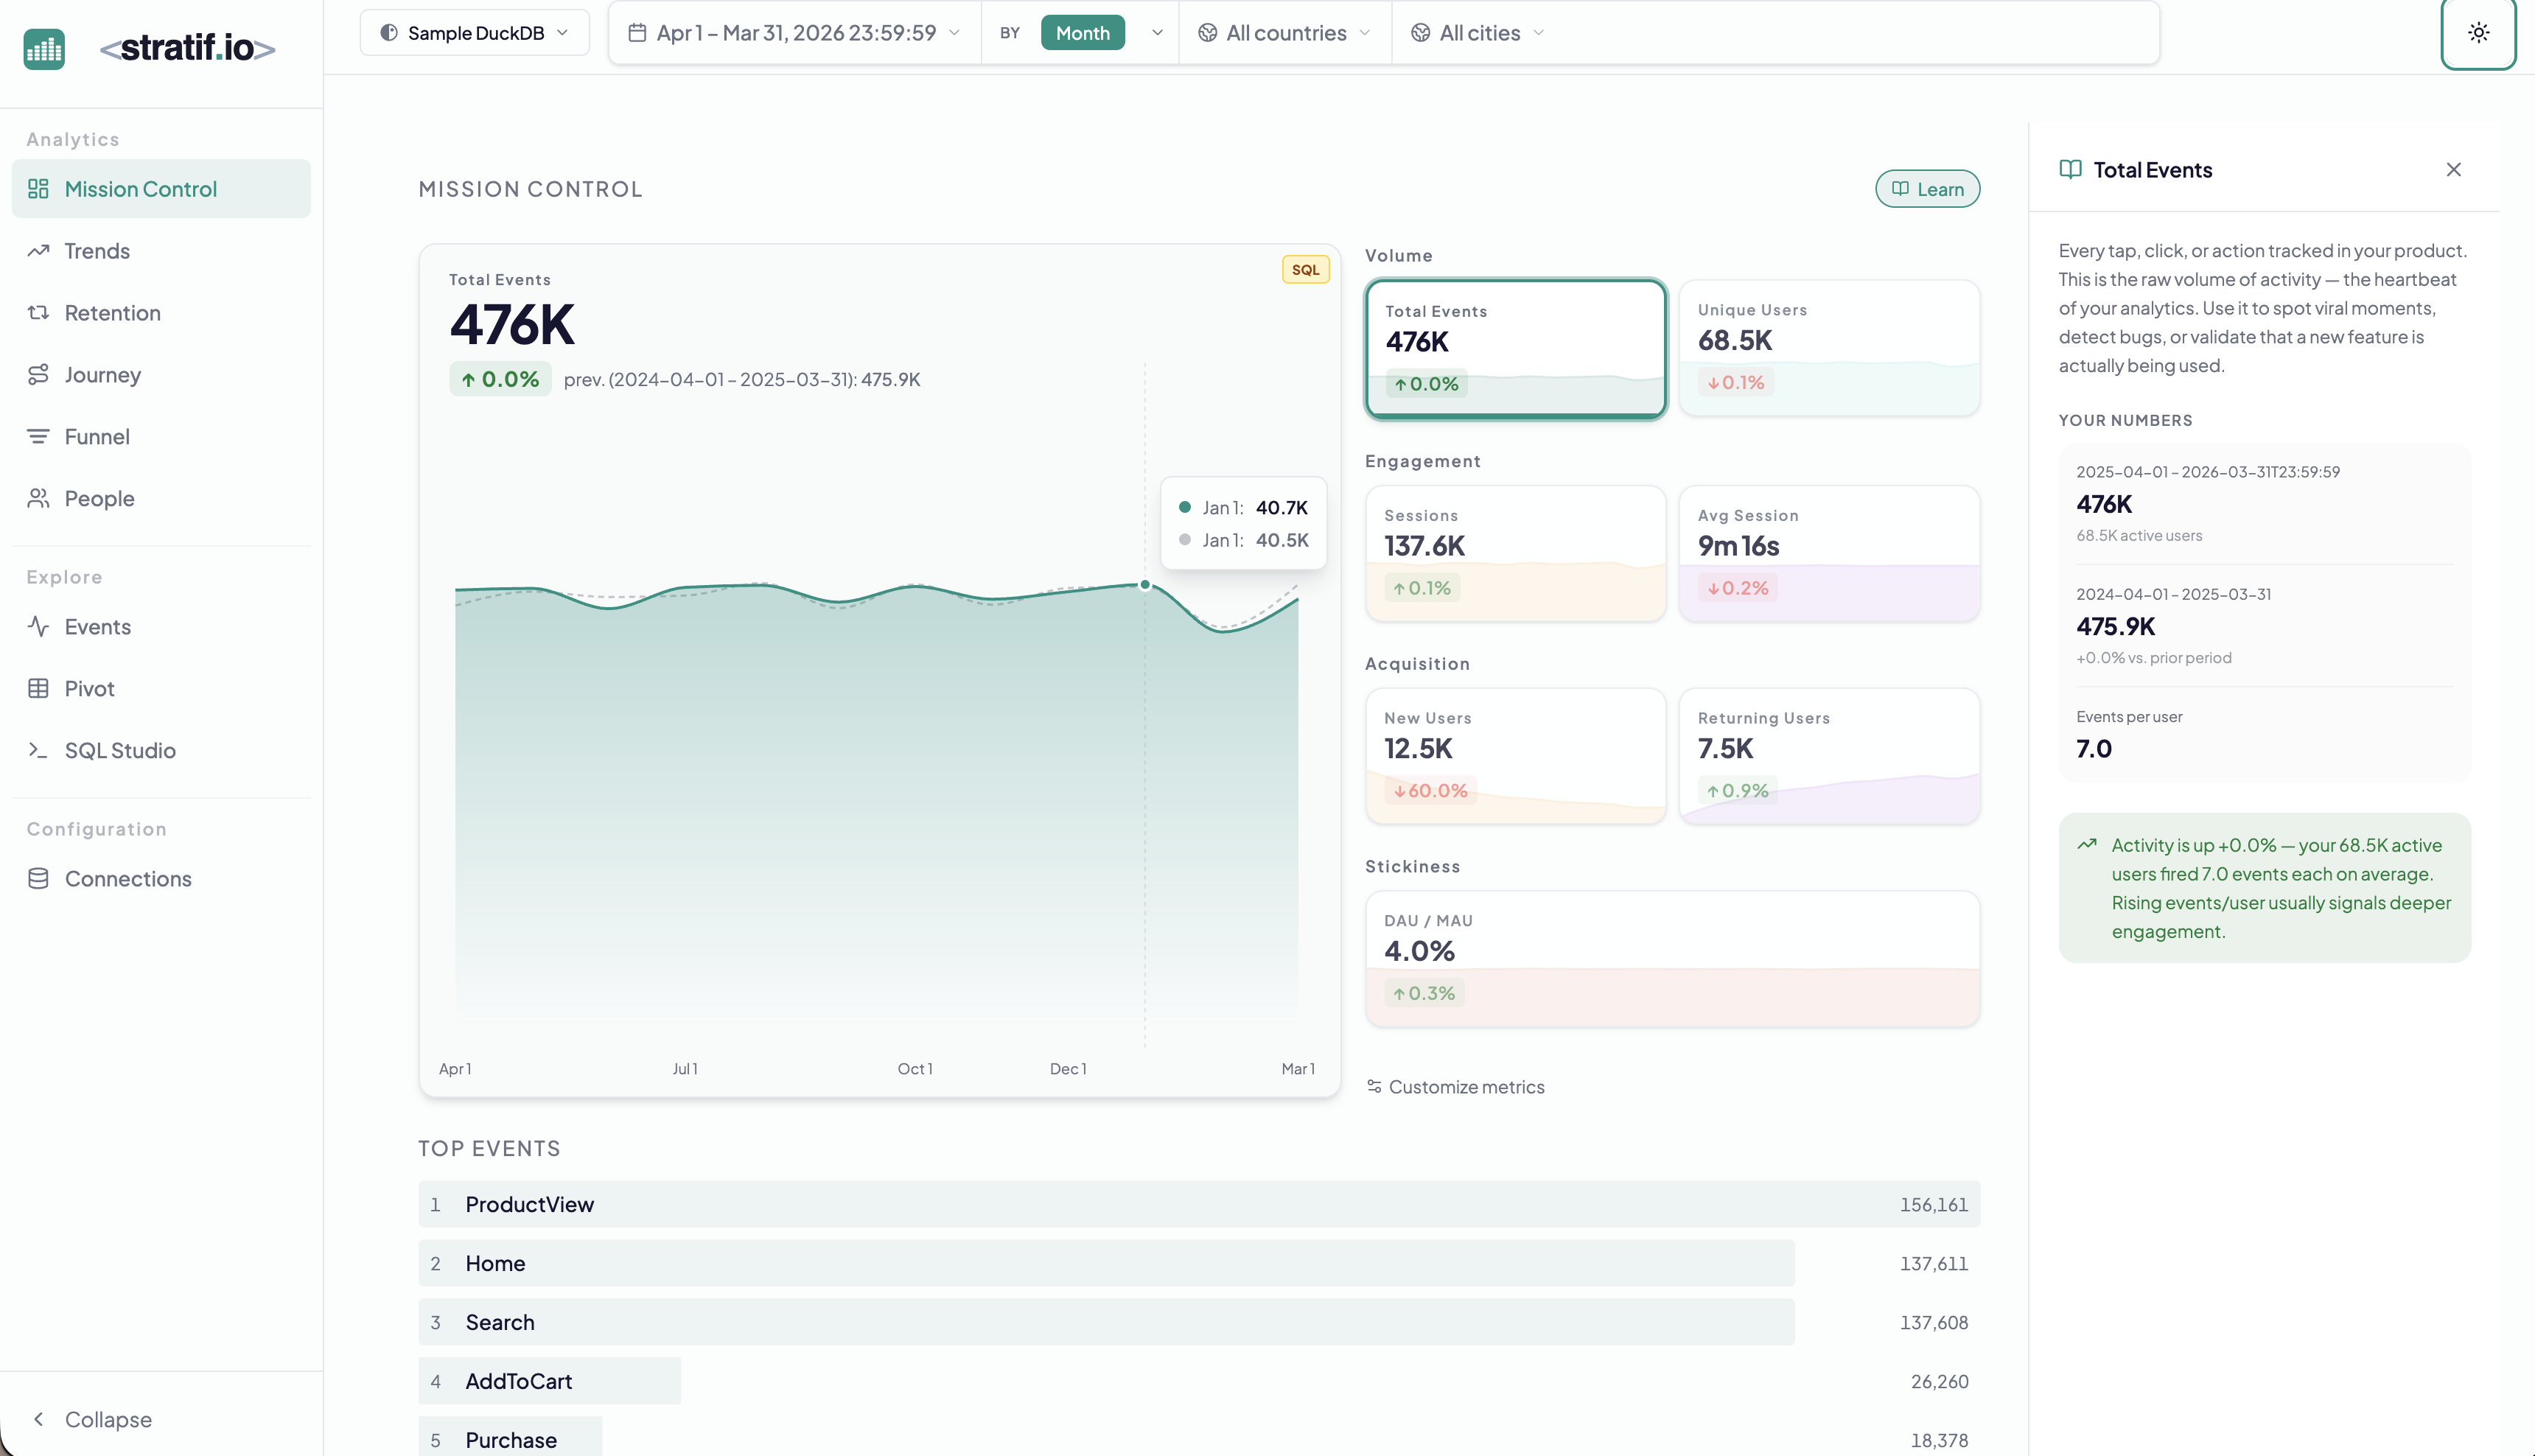
Mission ControlYour daily analytics home — active users, top events, session summary, and device breakdown.
TrendsTrack how event counts change over time with daily, weekly, or monthly granularity.
RetentionMeasure how many users return after performing a first action.
FunnelQuantify conversion rates between sequential steps in a user journey.
Paths (Journey)Explore the routes users take through your product, forward and backward.
PeopleBrowse individual user profiles, properties, and full event history.
Events ExplorerInspect raw events, filter by property, and audit your instrumentation.
PivotCross-tabulate any two dimensions against a metric for ad-hoc breakdowns.
SQL StudioWrite and run raw SQL directly against your warehouse from the dashboard.
Global FiltersApply date range, device, and custom filters across every view simultaneously.